California State Rail Plan 2007-08 to 2017-18
California State Rail Plan 2007-08 to 2017-18
California State Rail Plan 2007-08 to 2017-18
- No tags were found...

You also want an ePaper? Increase the reach of your titles
YUMPU automatically turns print PDFs into web optimized ePapers that Google loves.
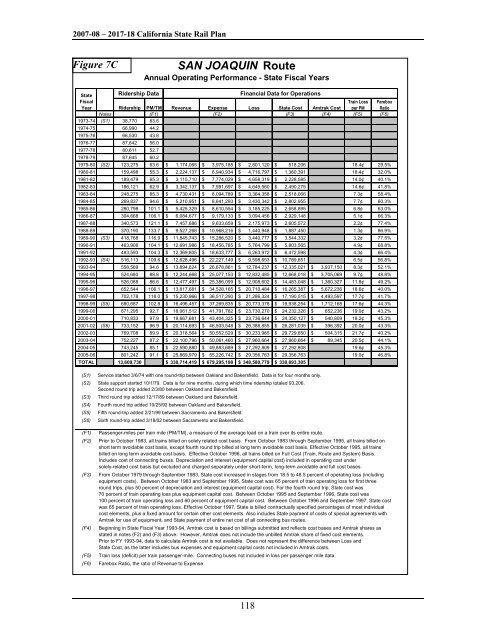
<strong>2007</strong>-<strong>08</strong> – <strong>2017</strong>-<strong>18</strong> <strong>California</strong> <strong>State</strong> <strong>Rail</strong> <strong>Plan</strong>Figure 7CSAN JOAQUIN RouteAnnual Operating Performance - <strong>State</strong> Fiscal Years<strong>State</strong> Ridership Data Financial Data for OperationsFiscal Train Loss FareboxYear Ridership PM/TM Revenue Expense Loss <strong>State</strong> Cost Amtrak Cost per PM RatioNotes (F1) (F2) (F3) (F4) (F5) (F6)1973-74 (S1) 38,770 83.61974-75 66,990 44.21975-76 66,530 43.81976-77 87,642 56.01977-78 80,611 52.71978-79 87,645 60.21979-80 (S2) 123,275 63.6 $ 1,174,065 $ 3,975,<strong>18</strong>5 $ 2,801,120 $ 5<strong>18</strong>,206<strong>18</strong>.4¢ 29.5%1980-81 159,498 55.3 $ 2,224,137 $ 6,940,934 $ 4,716,797 $ 1,360,391<strong>18</strong>.4¢ 32.0%1981-82 <strong>18</strong>9,479 65.3 $ 3,115,710 $ 7,774,029 $ 4,658,319 $ 2,228,58514.0¢ 40.1%1982-83 <strong>18</strong>6,121 62.9 $ 3,342,137 $ 7,991,697 $ 4,649,560 $ 2,490,27514.6¢ 41.8%1983-84 248,275 85.3 $ 4,730,431 $ 8,094,789 $ 3,364,358 $ 2,5<strong>18</strong>,0667.3¢ 58.4%1984-85 269,837 94.6 $ 5,210,951 $ 8,641,293 $ 3,430,342 $ 2,802,9557.7¢ 60.3%1985-86 280,798 101.1 $ 5,425,329 $ 8,610,554 $ 3,<strong>18</strong>5,225 $ 2,658,8956.8¢ 63.0%1986-87 304,668 106.1 $ 6,<strong>08</strong>4,677 $ 9,179,133 $ 3,094,456 $ 2,929,1485.1¢ 66.3%1987-88 340,573 121.1 $ 7,457,686 $ 9,633,659 $ 2,175,973 $ 2,605,5722.2¢ 77.4%1988-89 370,190 133.7 $ 9,527,268 $ 10,968,216 $ 1,440,948 $ 1,887,4501.3¢ 86.9%1989-90 (S3) 4<strong>18</strong>,768 116.9 $ 11,845,743 $ 15,286,520 $ 3,440,777 $ 3,544,3323.2¢ 77.5%1990-91 463,906 104.1 $ 12,691,986 $ <strong>18</strong>,456,785 $ 5,764,799 $ 5,803,5654.9¢ 68.8%1991-92 483,593 104.3 $ 12,369,805 $ <strong>18</strong>,633,777 $ 6,263,972 $ 6,472,5984.3¢ 66.4%1992-93 (S4) 516,113 109.6 $ 12,628,496 $ 22,227,149 $ 9,598,653 $ 10,789,6516.5¢ 56.8%1993-94 558,569 94.6 $ 13,894,624 $ 26,678,861 $ 12,784,237 $ 12,335,021 $ 3,937,150 8.3¢ 52.1%1994-95 524,680 88.8 $ 12,244,668 $ 25,077,153 $ 12,832,485 $ 12,668,0<strong>18</strong> $ 3,705,069 9.7¢ 48.8%1995-96 526,<strong>08</strong>8 86.6 $ 12,477,497 $ 25,386,099 $ 12,9<strong>08</strong>,602 $ 14,483,048 $ 1,360,327 11.8¢ 49.2%1996-97 652,544 106.1 $ 13,817,681 $ 34,528,165 $ 20,710,484 $ 16,265,387 $ 5,672,236 <strong>18</strong>.6¢ 40.0%1997-98 702,178 1<strong>18</strong>.0 $ 15,230,966 $ 36,517,290 $ 21,286,324 $ 17,190,515 $ 4,493,597 17.7¢ 41.7%1998-99 (S5) 680,687 102.8 $ 16,496,457 $ 37,269,835 $ 20,773,378 $ 19,938,254 $ 1,712,168 17.6¢ 44.3%1999-00 671,295 92.7 $ <strong>18</strong>,061,512 $ 41,791,782 $ 23,730,270 $ 24,232,326 $ 652,236 19.0¢ 43.2%2000-01 710,833 97.9 $ 19,667,681 $ 43,404,325 $ 23,736,644 $ 24,350,127 $ 540,809 <strong>18</strong>.2¢ 45.3%2001-02 (S6) 733,152 96.9 $ 20,114,693 $ 46,503,548 $ 26,388,855 $ 26,281,035 $ 396,392 20.0¢ 43.3%2002-03 769,7<strong>08</strong> 89.9 $ 20,3<strong>18</strong>,564 $ 50,552,529 $ 30,233,965 $ 29,729,650 $ 504,315 21.7¢ 40.2%2003-04 752,227 87.2 $ 22,100,796 $ 50,061,460 $ 27,960,664 $ 27,960,664 $ 89,345 20.5¢ 44.1%2004-05 743,245 85.1 $ 22,590,880 $ 49,883,689 $ 27,292,809 $ 27,292,8<strong>08</strong>19.6¢ 45.3%2005-06 801,242 91.1 $ 25,869,979 $ 55,226,742 $ 29,356,763 $ 29,356,76319.0¢ 46.8%TOTAL 13,609,730 $ 330,714,419 $ 679,295,198 $ 348,580,779 $ 330,693,305(S1) Service started 3/6/74 with one round-trip between Oakland and Bakersfield. Data is for four months only.(S2) <strong>State</strong> support started 10/1/79. Data is for nine months, during which time ridership <strong>to</strong>taled 93,206.Second round trip added 2/3/80 between Oakland and Bakersfield.(S3) Third round trip added 12/17/89 between Oakland and Bakersfield.(S4) Fourth round trip added 10/25/92 between Oakland and Bakersfield.(S5) Fifth round-trip added 2/21/99 between Sacramen<strong>to</strong> and Bakersfield.(S6) Sixth round-trip added 3/<strong>18</strong>/02 between Sacramen<strong>to</strong> and Bakersfield.(F1)(F2)(F3)(F4)(F5)(F6)Passenger-miles per train mile (PM/TM), a measure of the average load on a train over its entire route.Prior <strong>to</strong> Oc<strong>to</strong>ber 1983, all trains billed on solely related cost basis. From Oc<strong>to</strong>ber 1983 through September 1995, all trains billed onshort term avoidable cost basis, except fourth round trip billed at long term avoidable cost basis. Effective Oc<strong>to</strong>ber 1995, all trainsbilled on long term avoidable cost basis. Effective Oc<strong>to</strong>ber 1996, all trains billed on Full Cost (Train, Route and System) Basis.Includes cost of connecting buses. Depreciation and interest (equipment capital cost) included in operating cost undersolely-related cost basis but excluded and charged separately under short-term, long-term avoidable and full cost bases.From Oc<strong>to</strong>ber 1979 through September 1983, <strong>State</strong> cost increased in stages from <strong>18</strong>.5 <strong>to</strong> 48.5 percent of operating loss (includingequipment costs). Between Oc<strong>to</strong>ber 1983 and September 1995, <strong>State</strong> cost was 65 percent of train operating loss for first threeround trips, plus 50 percent of depreciation and interest (equipment capital cost). For the fourth round trip, <strong>State</strong> cost was70 percent of train operating loss plus equipment capital cost. Between Oc<strong>to</strong>ber 1995 and September 1996, <strong>State</strong> cost was100 percent of train operating loss and 60 percent of equipment capital cost. Between Oc<strong>to</strong>ber 1996 and September 1997, <strong>State</strong> costwas 65 percent of train operating loss. Effective Oc<strong>to</strong>ber 1997, <strong>State</strong> is billed contractually specified percentages of most individualcost elements, plus a fixed amount for certain other cost elements. Also includes <strong>State</strong> payment of costs of special agreements withAmtrak for use of equipment, and <strong>State</strong> payment of entire net cost of all connecting bus routes.Beginning in <strong>State</strong> Fiscal Year 1993-94, Amtrak cost is based on billings submitted and reflects cost bases and Amtrak shares asstated in notes (F2) and (F3) above. However, Amtrak does not include the unbilled Amtrak share of fixed cost elements.Prior <strong>to</strong> FY 1993-94, data <strong>to</strong> calculate Amtrak cost is not available. Does not represent the difference between Loss and<strong>State</strong> Cost, as the latter includes bus expenses and equipment capital costs not included in Amtrak costs.Train loss (deficit) per train passenger-mile. Connecting buses not included in loss per passenger mile data.Farebox Ratio, the ratio of Revenue <strong>to</strong> Expense.1<strong>18</strong>