- Page 2 and 3:
Drilling Fluids Reference Manual Ch
- Page 4 and 5:
Chapter 1 Table of Contents Fundame
- Page 6 and 7:
Baker Hughes Drilling Fluids Return
- Page 8 and 9:
Fundamentals of Drilling Fluids Cha
- Page 10 and 11:
Baker Hughes Drilling Fluids Contro
- Page 12 and 13:
Baker Hughes Drilling Fluids Physic
- Page 14 and 15:
Baker Hughes Drilling Fluids Newton
- Page 16 and 17:
Baker Hughes Drilling Fluids Figure
- Page 18 and 19:
Baker Hughes Drilling Fluids Contin
- Page 20 and 21:
Baker Hughes Drilling Fluids The fl
- Page 22 and 23:
Baker Hughes Drilling Fluids As def
- Page 24 and 25:
Baker Hughes Drilling Fluids Figure
- Page 26 and 27:
Baker Hughes Drilling Fluids Table
- Page 28 and 29:
Baker Hughes Drilling Fluids Gel St
- Page 30 and 31:
Baker Hughes Drilling Fluids drilli
- Page 32 and 33:
Baker Hughes Drilling Fluids Time T
- Page 34 and 35:
Baker Hughes Drilling Fluids Then,
- Page 36 and 37:
Baker Hughes Drilling Fluids Low-Gr
- Page 38 and 39:
Baker Hughes Drilling Fluids The pH
- Page 40 and 41:
Baker Hughes Drilling Fluids Exampl
- Page 42 and 43:
Baker Hughes Drilling Fluids Using
- Page 44 and 45:
Baker Hughes Drilling Fluids Drill-
- Page 46 and 47:
Baker Hughes Drilling Fluids MBT (M
- Page 48 and 49:
Baker Hughes Drilling Fluids At dif
- Page 50 and 51:
Baker Hughes Drilling Fluids Figure
- Page 52 and 53:
Baker Hughes Drilling Fluids Primar
- Page 54 and 55:
Baker Hughes Drilling Fluids Nomenc
- Page 56 and 57:
Formation Mechanics Chapter Two For
- Page 58 and 59:
Table of Contents List of Figures F
- Page 60 and 61:
Formation Mechanics • 3 million g
- Page 62 and 63:
Formation Mechanics Hydration Mecha
- Page 64 and 65:
Formation Mechanics Attapulgite Fig
- Page 66 and 67:
Formation Mechanics in the outer si
- Page 68 and 69:
Formation Mechanics • Calcareous
- Page 70 and 71:
Formation Mechanics called “bio
- Page 72 and 73:
Formation Mechanics Reservoir Press
- Page 74 and 75:
Formation Mechanics Selecting the p
- Page 76 and 77:
Formation Mechanics Figure 2-12 Pho
- Page 78 and 79:
Water-Based Drilling Fluids Chapter
- Page 80 and 81:
Figure 3-7 The Sodium Chloride Stru
- Page 82 and 83:
Water-base Drilling Fluids Chapter
- Page 84 and 85:
Baker Hughes Drilling Fluids Atomic
- Page 86 and 87:
Baker Hughes Drilling Fluids Isotop
- Page 88 and 89:
Baker Hughes Drilling Fluids Atoms
- Page 90 and 91:
Baker Hughes Drilling Fluids Table
- Page 92 and 93:
Baker Hughes Drilling Fluids Proper
- Page 94 and 95:
Baker Hughes Drilling Fluids Table
- Page 96 and 97:
Baker Hughes Drilling Fluids Solubi
- Page 98 and 99:
Baker Hughes Drilling Fluids wettin
- Page 100 and 101:
Baker Hughes Drilling Fluids The re
- Page 102 and 103:
Baker Hughes Drilling Fluids Chemic
- Page 104 and 105:
Baker Hughes Drilling Fluids attrac
- Page 106 and 107:
Baker Hughes Drilling Fluids For a
- Page 108 and 109:
Baker Hughes Drilling Fluids Gradua
- Page 110 and 111:
Baker Hughes Drilling Fluids Theref
- Page 112 and 113:
Baker Hughes Drilling Fluids Conven
- Page 114 and 115:
Baker Hughes Drilling Fluids Table
- Page 116 and 117:
Baker Hughes Drilling Fluids With g
- Page 118 and 119:
Baker Hughes Drilling Fluids above
- Page 120 and 121:
Baker Hughes Drilling Fluids revers
- Page 122 and 123:
Baker Hughes Drilling Fluids of add
- Page 124 and 125:
Baker Hughes Drilling Fluids of ava
- Page 126 and 127:
Baker Hughes Drilling Fluids Table
- Page 128 and 129:
Baker Hughes Drilling Fluids Mist D
- Page 130 and 131:
Baker Hughes Drilling Fluids potass
- Page 132 and 133:
Baker Hughes Drilling Fluids Comple
- Page 134 and 135:
Baker Hughes Drilling Fluids 6. Fil
- Page 136 and 137:
Baker Hughes Drilling Fluids Defloc
- Page 138 and 139:
Baker Hughes Drilling Fluids Calciu
- Page 140 and 141:
Baker Hughes Drilling Fluids levels
- Page 142 and 143:
Baker Hughes Drilling Fluids Filtra
- Page 144 and 145:
Baker Hughes Drilling Fluids weight
- Page 146 and 147:
Baker Hughes Drilling Fluids Standa
- Page 148 and 149:
Baker Hughes Drilling Fluids GLYCOL
- Page 150 and 151:
Baker Hughes Drilling Fluids Table
- Page 152 and 153:
Baker Hughes Drilling Fluids Salt C
- Page 154 and 155:
Baker Hughes Drilling Fluids pressu
- Page 156 and 157:
Baker Hughes Drilling Fluids Figure
- Page 158 and 159:
Baker Hughes Drilling Fluids Filter
- Page 160 and 161:
Baker Hughes Drilling Fluids System
- Page 162 and 163:
Baker Hughes Drilling Fluids • Pr
- Page 164 and 165:
Baker Hughes Drilling Fluids AQUA-D
- Page 166 and 167:
Baker Hughes Drilling Fluids Figure
- Page 168 and 169:
Baker Hughes Drilling Fluids . Tabl
- Page 170 and 171:
Baker Hughes Drilling Fluids Seawat
- Page 172 and 173:
Baker Hughes Drilling Fluids 6. Pou
- Page 174 and 175:
Baker Hughes Drilling Fluids 5. Rin
- Page 176 and 177:
Baker Hughes Drilling Fluids PERFOR
- Page 178 and 179:
Baker Hughes Drilling Fluids • Th
- Page 180 and 181:
Baker Hughes Drilling Fluids densit
- Page 182 and 183:
Baker Hughes Drilling Fluids Equipm
- Page 184 and 185:
Baker Hughes Drilling Fluids 3. Wit
- Page 186 and 187:
Baker Hughes Drilling Fluids Refere
- Page 188 and 189:
Chapter Four Contamination of Water
- Page 190 and 191:
Contamination of Water-Base Muds Ch
- Page 192 and 193:
Baker Hughes Drilling Fluids saltwa
- Page 194 and 195:
Baker Hughes Drilling Fluids Oven t
- Page 196 and 197:
Baker Hughes Drilling Fluids Carbon
- Page 198 and 199:
Baker Hughes Drilling Fluids Table
- Page 200 and 201:
Baker Hughes Drilling Fluids The te
- Page 202 and 203:
Baker Hughes Drilling Fluids treatm
- Page 204 and 205:
Baker Hughes Drilling Fluids when a
- Page 206 and 207:
Chapter 5 Table of Contents Oil / S
- Page 208 and 209:
Baker Hughes Drilling Fluids Solids
- Page 210 and 211:
Baker Hughes Drilling Fluids Table
- Page 212 and 213:
Oil / Synthetic Fluids 3. Lubricity
- Page 214 and 215:
Oil / Synthetic Fluids returns may
- Page 216 and 217:
Oil / Synthetic Fluids the area of
- Page 218 and 219:
Oil / Synthetic Fluids charged (rep
- Page 220 and 221:
Oil / Synthetic Fluids Ions surroun
- Page 222 and 223:
Oil / Synthetic Fluids Surface ener
- Page 224 and 225:
Oil / Synthetic Fluids to form oil
- Page 226 and 227:
Oil / Synthetic Fluids As indicated
- Page 228 and 229:
Oil / Synthetic Fluids Oil Density
- Page 230 and 231:
Oil / Synthetic Fluids As the conce
- Page 232 and 233:
Oil / Synthetic Fluids lower pH. Th
- Page 234 and 235:
Oil / Synthetic Fluids One of the m
- Page 236 and 237:
Oil / Synthetic Fluids Amine Lignit
- Page 238 and 239:
Oil / Synthetic Fluids The MAGMA-TE
- Page 240 and 241:
Oil / Synthetic Fluids System Maint
- Page 242 and 243:
Oil / Synthetic Fluids CARBO-MUL ®
- Page 244 and 245:
Oil / Synthetic Fluids CARBO-TEC ®
- Page 246 and 247:
Oil / Synthetic Fluids CARBO-VIS C
- Page 248 and 249:
Oil / Synthetic Fluids MAGMA-TROL
- Page 250 and 251:
Oil / Synthetic Fluids OMNI-MUL ®
- Page 252 and 253:
Oil / Synthetic Fluids OMNI-TROL /
- Page 254 and 255:
Oil / Synthetic Fluids 8. Do not us
- Page 256 and 257:
Oil / Synthetic Fluids Solids contr
- Page 258 and 259:
Oil / Synthetic Fluids Figure 5-22
- Page 260 and 261:
Oil / Synthetic Fluids Salts Since
- Page 262 and 263:
Oil / Synthetic Fluids Table 5-28 C
- Page 264 and 265:
Oil / Synthetic Fluids Table 5-30 C
- Page 266 and 267:
Oil / Synthetic Fluids Table 5-32 C
- Page 268 and 269:
Oil / Synthetic Fluids Table 5-34 F
- Page 270 and 271:
Oil / Synthetic Fluids Table 5-36 P
- Page 272 and 273:
Oil / Synthetic Fluids Table 5-38 F
- Page 274 and 275:
Oil / Synthetic Fluids Metric Conve
- Page 276 and 277:
Oil / Synthetic Fluids Metric Conve
- Page 278 and 279:
Oil / Synthetic Fluids • Metric C
- Page 280 and 281:
Reservoir Application Fluids Chapte
- Page 282 and 283:
TABLE OF CONTENTS System Benefits..
- Page 284 and 285:
TABLE OF CONTENTS TABLE 6 - 19 PREP
- Page 286 and 287:
RESERVOIR APPLICATION FLUIDS In pet
- Page 288 and 289:
RESERVOIR APPLICATION FLUIDS Figure
- Page 290 and 291:
RESERVOIR APPLICATION FLUIDS Clays
- Page 292 and 293:
RESERVOIR APPLICATION FLUIDS Conden
- Page 294 and 295:
RESERVOIR APPLICATION FLUIDS The Sh
- Page 296 and 297:
RESERVOIR APPLICATION FLUIDS Figure
- Page 298 and 299:
RESERVOIR APPLICATION FLUIDS Struct
- Page 300 and 301:
RESERVOIR APPLICATION FLUIDS contai
- Page 302 and 303:
RESERVOIR APPLICATION FLUIDS throat
- Page 304 and 305:
RESERVOIR APPLICATION FLUIDS soluti
- Page 306 and 307:
RESERVOIR APPLICATION FLUIDS tested
- Page 308 and 309:
RESERVOIR APPLICATION FLUIDS • 0.
- Page 310 and 311:
RESERVOIR APPLICATION FLUIDS Under-
- Page 312 and 313:
RESERVOIR APPLICATION FLUIDS Typica
- Page 314 and 315:
RESERVOIR APPLICATION FLUIDS Compar
- Page 316 and 317:
RESERVOIR APPLICATION FLUIDS CLEAR-
- Page 318 and 319:
RESERVOIR APPLICATION FLUIDS 1.20 S
- Page 320 and 321:
RESERVOIR APPLICATION FLUIDS Reserv
- Page 322 and 323:
RESERVOIR APPLICATION FLUIDS Densit
- Page 324 and 325:
RESERVOIR APPLICATION FLUIDS of 5%
- Page 326 and 327:
RESERVOIR APPLICATION FLUIDS The te
- Page 328 and 329:
RESERVOIR APPLICATION FLUIDS Brine
- Page 330 and 331:
RESERVOIR APPLICATION FLUIDS Theref
- Page 332 and 333:
RESERVOIR APPLICATION FLUIDS 6. Amo
- Page 334 and 335:
RESERVOIR APPLICATION FLUIDS The ta
- Page 336 and 337:
RESERVOIR APPLICATION FLUIDS 1 Perc
- Page 338 and 339:
RESERVOIR APPLICATION FLUIDS Formul
- Page 340 and 341:
RESERVOIR APPLICATION FLUIDS Metric
- Page 342 and 343:
RESERVOIR APPLICATION FLUIDS Exampl
- Page 344 and 345:
RESERVOIR APPLICATION FLUIDS Conver
- Page 346 and 347:
RESERVOIR APPLICATION FLUIDS Exampl
- Page 348 and 349:
RESERVOIR APPLICATION FLUIDS Densit
- Page 350 and 351:
RESERVOIR APPLICATION FLUIDS Table
- Page 352 and 353:
RESERVOIR APPLICATION FLUIDS CLEAR-
- Page 354 and 355:
RESERVOIR APPLICATION FLUIDS CLEAR-
- Page 356 and 357:
RESERVOIR APPLICATION FLUIDS CLEAR-
- Page 358 and 359:
RESERVOIR APPLICATION FLUIDS Proper
- Page 360 and 361:
RESERVOIR APPLICATION FLUIDS 50 Pou
- Page 362 and 363:
RESERVOIR APPLICATION FLUIDS 220 50
- Page 364 and 365:
RESERVOIR APPLICATION FLUIDS These
- Page 366 and 367:
RESERVOIR APPLICATION FLUIDS The ob
- Page 368 and 369:
RESERVOIR APPLICATION FLUIDS Numero
- Page 370 and 371:
RESERVOIR APPLICATION FLUIDS Run th
- Page 372 and 373:
RESERVOIR APPLICATION FLUIDS Water-
- Page 374 and 375:
RESERVOIR APPLICATION FLUIDS select
- Page 376 and 377:
RESERVOIR APPLICATION FLUIDS Choke
- Page 378 and 379:
RESERVOIR APPLICATION FLUIDS Turbul
- Page 380 and 381:
RESERVOIR APPLICATION FLUIDS End of
- Page 382 and 383:
RESERVOIR APPLICATION FLUIDS • Pr
- Page 384 and 385:
RESERVOIR APPLICATION FLUIDS BAKER
- Page 386 and 387:
RESERVOIR APPLICATION FLUIDS well i
- Page 388 and 389:
RESERVOIR APPLICATION FLUIDS Fluid
- Page 390 and 391:
RESERVOIR APPLICATION FLUIDS Lab Va
- Page 392 and 393:
RESERVOIR APPLICATION FLUIDS Progra
- Page 394 and 395:
RESERVOIR APPLICATION FLUIDS • Pu
- Page 396 and 397:
RESERVOIR APPLICATION FLUIDS Figure
- Page 398 and 399:
RESERVOIR APPLICATION FLUIDS REFERE
- Page 400 and 401:
Chapter 7 Table of Contents BOREHOL
- Page 402 and 403:
BOREHOLE PROBLEMS BOREHOLE PROBLEMS
- Page 404 and 405:
BOREHOLE PROBLEMS Competent Formati
- Page 406 and 407:
BOREHOLE PROBLEMS • Allow for inc
- Page 408 and 409:
BOREHOLE PROBLEMS When shales react
- Page 410 and 411:
BOREHOLE PROBLEMS • An unplanned
- Page 412 and 413:
BOREHOLE PROBLEMS Should the pipe b
- Page 414 and 415:
BOREHOLE PROBLEMS dispersion. The e
- Page 416 and 417:
BOREHOLE PROBLEMS Figure 7 - 4 Mech
- Page 418 and 419:
BOREHOLE PROBLEMS • High salt con
- Page 420 and 421:
BOREHOLE PROBLEMS Polyglycol Shale
- Page 422 and 423:
BOREHOLE PROBLEMS LOSS OF CIRCULATI
- Page 424 and 425:
BOREHOLE PROBLEMS • Use of fluid
- Page 426 and 427:
BOREHOLE PROBLEMS If water-absorbin
- Page 428 and 429:
BOREHOLE PROBLEMS 2. Mix slurry vol
- Page 430 and 431:
BOREHOLE PROBLEMS Slurry Volume (bb
- Page 432 and 433:
BOREHOLE PROBLEMS accelerator is av
- Page 434 and 435:
BOREHOLE PROBLEMS • Elimination o
- Page 436 and 437:
BOREHOLE PROBLEMS S = pressure exis
- Page 438 and 439:
BOREHOLE PROBLEMS Grogan Technique
- Page 440 and 441:
BOREHOLE PROBLEMS Fluid Density (lb
- Page 442 and 443:
BOREHOLE PROBLEMS V w = ⎡ C Ph
- Page 444 and 445:
BOREHOLE PROBLEMS Fluid Density Ins
- Page 446 and 447:
BOREHOLE PROBLEMS OMNI-LUBE is an e
- Page 448 and 449:
BOREHOLE PROBLEMS Drilling Fluid Pr
- Page 450 and 451:
BOREHOLE PROBLEMS Flash Point When
- Page 452 and 453:
BOREHOLE PROBLEMS Planning The succ
- Page 454 and 455:
BOREHOLE PROBLEMS 16. Dye, B. et al
- Page 456 and 457:
Chapter 8 Table of Contents CORROSI
- Page 458 and 459:
CORROSION CORROSION Chapter 8 Corro
- Page 460 and 461:
CORROSION Cathode Anode 1st Step O
- Page 462 and 463:
CORROSION 1. Source - Formations ar
- Page 464 and 465:
CORROSION 7. Recommended Treatment
- Page 466 and 467:
CORROSION Factors Coupon Dimensions
- Page 468 and 469:
CORROSION Film-Forming Amines O.D.
- Page 470 and 471:
CORROSION are (1) to inhibit corros
- Page 472 and 473:
CORROSION 2200 2000 Conductance Mho
- Page 474 and 475:
CORROSION Figure 8- 3 Oxygen Solubi
- Page 476 and 477:
Chapter Nine Hydraulics Hydraulics
- Page 478 and 479:
TABLE OF CONTENTS List of Figures F
- Page 480 and 481:
HYDRAULICS required to do this is m
- Page 482 and 483:
HYDRAULICS the Bingham Plastic, Pow
- Page 484 and 485:
HYDRAULICS Figure 9 - 6 Application
- Page 486 and 487:
HYDRAULICS model is generally accep
- Page 488 and 489:
HYDRAULICS each portion of the circ
- Page 490 and 491:
HYDRAULICS μ ep = effective viscos
- Page 492 and 493:
HYDRAULICS Then solve for Q c , whe
- Page 494 and 495:
HYDRAULICS ρ = fluid density, lb m
- Page 496 and 497:
HYDRAULICS where: P n = total press
- Page 498 and 499:
HYDRAULICS where: 2 2 1/2 1303.797
- Page 500 and 501:
HYDRAULICS where: V p = -----------
- Page 502 and 503:
HYDRAULICS The ability of a drillin
- Page 504 and 505:
HYDRAULICS ρ = fluid density, lb m
- Page 506 and 507:
HYDRAULICS SUMMARY SM ADVANTAGE Eng
- Page 508 and 509:
HYDRAULICS Figure 9 - 11 Well Schem
- Page 510 and 511:
HYDRAULICS 4. Calculate the Reynold
- Page 512 and 513:
HYDRAULICS 24 f a = -------- Re a =
- Page 514 and 515:
HYDRAULICS Exercise: Calculate the
- Page 516 and 517:
HYDRAULICS NOMENCLATURE A t C C a D
- Page 518 and 519:
HYDRAULICS REFERENCES 1. ADVANTAGE
- Page 520 and 521:
Chapter 10 Table of Contents MECHAN
- Page 522 and 523:
MECHANICAL SOLIDS CONTROL • Speci
- Page 524 and 525:
MECHANICAL SOLIDS CONTROL Figure 10
- Page 526 and 527:
MECHANICAL SOLIDS CONTROL Dispersio
- Page 528 and 529:
MECHANICAL SOLIDS CONTROL oil fluid
- Page 530 and 531:
MECHANICAL SOLIDS CONTROL Test Siev
- Page 532 and 533:
MECHANICAL SOLIDS CONTROL Figure 10
- Page 534 and 535:
MECHANICAL SOLIDS CONTROL Fluid (Mu
- Page 536 and 537:
MECHANICAL SOLIDS CONTROL for high-
- Page 538 and 539: MECHANICAL SOLIDS CONTROL RMS Centr
- Page 540 and 541: MECHANICAL SOLIDS CONTROL Figure 10
- Page 542 and 543: MECHANICAL SOLIDS CONTROL Figure 10
- Page 544 and 545: MECHANICAL SOLIDS CONTROL NOMENCLAT
- Page 546 and 547: Chapter 11 Table of Contents HORIZO
- Page 548 and 549: HORIZONTAL AND EXTENDED REACH DRILL
- Page 550 and 551: HORIZONTAL AND EXTENDED REACH DRILL
- Page 552 and 553: HORIZONTAL AND EXTENDED REACH DRILL
- Page 554 and 555: HORIZONTAL AND EXTENDED REACH DRILL
- Page 556 and 557: HORIZONTAL AND EXTENDED REACH DRILL
- Page 558 and 559: HORIZONTAL AND EXTENDED REACH DRILL
- Page 560 and 561: HORIZONTAL AND EXTENDED REACH DRILL
- Page 562 and 563: HORIZONTAL AND EXTENDED REACH DRILL
- Page 564 and 565: HORIZONTAL AND EXTENDED REACH DRILL
- Page 566 and 567: HORIZONTAL AND EXTENDED REACH DRILL
- Page 568 and 569: HORIZONTAL AND EXTENDED REACH DRILL
- Page 570 and 571: HORIZONTAL AND EXTENDED REACH DRILL
- Page 572 and 573: HORIZONTAL AND EXTENDED REACH DRILL
- Page 574 and 575: HORIZONTAL AND EXTENDED REACH DRILL
- Page 576 and 577: Pressure Prediction and Control Cha
- Page 578 and 579: TABLE OF CONTENTS Procedure for Pre
- Page 580 and 581: PRESSURE PREDICTION AND CONTROL Cha
- Page 582 and 583: PRESSURE PREDICTION AND CONTROL Abn
- Page 584 and 585: PRESSURE PREDICTION AND CONTROL inc
- Page 586 and 587: PRESSURE PREDICTION AND CONTROL Pre
- Page 590 and 591: PRESSURE PREDICTION AND CONTROL DRI
- Page 592 and 593: PRESSURE PREDICTION AND CONTROL The
- Page 594 and 595: PRESSURE PREDICTION AND CONTROL Cha
- Page 596 and 597: PRESSURE PREDICTION AND CONTROL •
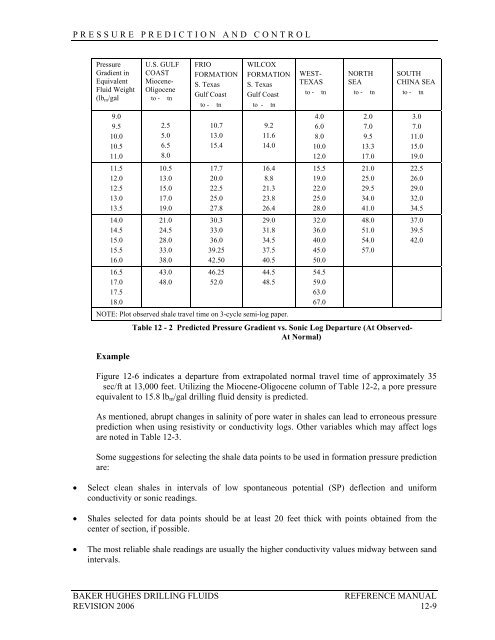
- Page 598 and 599: PRESSURE PREDICTION AND CONTROL Fig
- Page 600 and 601: PRESSURE PREDICTION AND CONTROL in
- Page 602 and 603: PRESSURE PREDICTION AND CONTROL •
- Page 604 and 605: PRESSURE PREDICTION AND CONTROL cap
- Page 606 and 607: PRESSURE PREDICTION AND CONTROL Oth
- Page 608 and 609: PRESSURE PREDICTION AND CONTROL Thu
- Page 610 and 611: PRESSURE PREDICTION AND CONTROL PRE
- Page 612 and 613: PRESSURE PREDICTION AND CONTROL Bak
- Page 614 and 615: PRESSURE PREDICTION AND CONTROL Bar
- Page 616 and 617: PRESSURE PREDICTION AND CONTROL Tot
- Page 618 and 619: PRESSURE PREDICTION AND CONTROL Low
- Page 620 and 621: PRESSURE PREDICTION AND CONTROL Flu
- Page 622 and 623: PRESSURE PREDICTION AND CONTROL REF
- Page 624 and 625: Deepwater Drilling Fluids Chapter T
- Page 626 and 627: TABLE OF CONTENTS List of Figures F
- Page 628 and 629: TABLE OF CONTENTS Shallow water flo
- Page 630 and 631: TABLE OF CONTENTS AQUEOUS VS NON-AQ
- Page 632 and 633: TABLE OF CONTENTS AQUEOUS SYSTEMS A
- Page 634 and 635: TABLE OF CONTENTS NEW-DRILL® Cutti
- Page 636 and 637: TABLE OF CONTENTS • Logistics are
- Page 638 and 639:
TABLE OF CONTENTS Dodecahedron Gas
- Page 640 and 641:
TABLE OF CONTENTS Cementing • Cem
- Page 642 and 643:
TABLE OF CONTENTS HYDRATE FORMATION
- Page 644 and 645:
TABLE OF CONTENTS • The ability t
- Page 646 and 647:
TABLE OF CONTENTS HYDRAULIC MODELIN
- Page 648 and 649:
TABLE OF CONTENTS Figure 13 - 10 Te
- Page 650 and 651:
TABLE OF CONTENTS graphically too.
- Page 652 and 653:
TABLE OF CONTENTS REFERENCES 1. Zam
- Page 654 and 655:
Chapter Fourteen Fluids Environment
- Page 656 and 657:
TABLE OF CONTENTS Filtration of Gra
- Page 658 and 659:
FLUIDS ENVIRONMENTAL SERVICES The w
- Page 660 and 661:
FLUIDS ENVIRONMENTAL SERVICES have
- Page 662 and 663:
FLUIDS ENVIRONMENTAL SERVICES Early
- Page 664 and 665:
FLUIDS ENVIRONMENTAL SERVICES Infor
- Page 666 and 667:
FLUIDS ENVIRONMENTAL SERVICES Step
- Page 668 and 669:
FLUIDS ENVIRONMENTAL SERVICES • S
- Page 670 and 671:
FLUIDS ENVIRONMENTAL SERVICES in or
- Page 672 and 673:
FLUIDS ENVIRONMENTAL SERVICES OPERA
- Page 674 and 675:
FLUIDS ENVIRONMENTAL SERVICES Lesso
- Page 676 and 677:
FLUIDS ENVIRONMENTAL SERVICES BEST
- Page 678 and 679:
FLUIDS ENVIRONMENTAL SERVICES • P
- Page 680 and 681:
FLUIDS ENVIRONMENTAL SERVICES • R
- Page 682 and 683:
FLUIDS ENVIRONMENTAL SERVICES WASTE
- Page 684 and 685:
FLUIDS ENVIRONMENTAL SERVICES Therm
- Page 686 and 687:
FLUIDS ENVIRONMENTAL SERVICES th e
- Page 688 and 689:
FLUIDS ENVIRONMENTAL SERVICES SEPAR
- Page 690 and 691:
FLUIDS ENVIRONMENTAL SERVICES Decan
- Page 692 and 693:
FLUIDS ENVIRONMENTAL SERVICES • D
- Page 694 and 695:
FLUIDS ENVIRONMENTAL SERVICES • H
- Page 696 and 697:
FLUIDS ENVIRONMENTAL SERVICES Main
- Page 698 and 699:
FLUIDS ENVIRONMENTAL SERVICES PROCE
- Page 700 and 701:
FLUIDS ENVIRONMENTAL SERVICES DIMEN
- Page 702 and 703:
FLUIDS ENVIRONMENTAL SERVICES Disch
- Page 704 and 705:
FLUIDS ENVIRONMENTAL SERVICES • H
- Page 706:
FLUIDS ENVIRONMENTAL SERVICES CUTTI
- Page 710:
FLUIDS ENVIRONMENTAL SERVICES TRANS
- Page 714:
FLUIDS ENVIRONMENTAL SERVICES TRANS
- Page 717:
FLUIDS ENVIRONMENTAL SERVICES Typic
- Page 721:
FLUIDS ENVIRONMENTAL SERVICES BAKER
- Page 724 and 725:
FLUIDS ENVIRONMENTAL SERVICES Fluid
- Page 726 and 727:
FLUIDS ENVIRONMENTAL SERVICES A typ
- Page 728 and 729:
FLUIDS ENVIRONMENTAL SERVICES Featu
- Page 730 and 731:
FLUIDS ENVIRONMENTAL SERVICES Cartr
- Page 732 and 733:
FLUIDS ENVIRONMENTAL SERVICES surfa
- Page 734 and 735:
GLOSSARY OF TERMS Chapter 15 GLOSSA
- Page 736 and 737:
GLOSSARY OF TERMS Aluminum Stearate
- Page 738 and 739:
GLOSSARY OF TERMS asphaltenes. Asph
- Page 740 and 741:
GLOSSARY OF TERMS controlled enviro
- Page 742 and 743:
GLOSSARY OF TERMS hole-cleaning cap
- Page 744 and 745:
GLOSSARY OF TERMS Cloud Point - The
- Page 746 and 747:
GLOSSARY OF TERMS Cycle (Circulatio
- Page 748 and 749:
GLOSSARY OF TERMS Dissociation - Th
- Page 750 and 751:
GLOSSARY OF TERMS Fiber or Fibrous
- Page 752 and 753:
GLOSSARY OF TERMS Fluid Flow - The
- Page 754 and 755:
GLOSSARY OF TERMS Gel Strength - Th
- Page 756 and 757:
GLOSSARY OF TERMS Homogeneous - Of
- Page 758 and 759:
GLOSSARY OF TERMS Hydrophilic-Lypop
- Page 760 and 761:
GLOSSARY OF TERMS Iodine Number - T
- Page 762 and 763:
GLOSSARY OF TERMS Limestone - See C
- Page 764 and 765:
GLOSSARY OF TERMS Micron (µ) = MU
- Page 766 and 767:
GLOSSARY OF TERMS Neat Cement - A s
- Page 768 and 769:
GLOSSARY OF TERMS Percent - For wei
- Page 770 and 771:
GLOSSARY OF TERMS not that space is
- Page 772 and 773:
GLOSSARY OF TERMS Resistivity - The
- Page 774 and 775:
GLOSSARY OF TERMS complex structure
- Page 776 and 777:
GLOSSARY OF TERMS Sodium Bicarbonat
- Page 778 and 779:
GLOSSARY OF TERMS Streaming Potenti
- Page 780 and 781:
GLOSSARY OF TERMS Thixotropy - The
- Page 782 and 783:
GLOSSARY OF TERMS Viscosity, Funnel