GENERAL MEETING DRAFT - Bankier.pl
GENERAL MEETING DRAFT - Bankier.pl
GENERAL MEETING DRAFT - Bankier.pl

You also want an ePaper? Increase the reach of your titles
YUMPU automatically turns print PDFs into web optimized ePapers that Google loves.
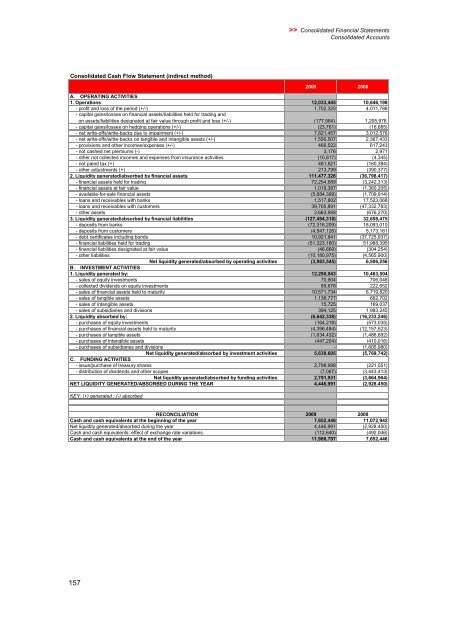
Consolidated Cash Flow Statement (indirect method)<br />
RELASEMESTRALE CONSOLIDATA<br />
157<br />
>> Consolidated Financial Statements<br />
Consolidated Accounts<br />
2009 2008<br />
A. OPERATING ACTIVITIES<br />
1. Operations 12,033,445 10,646,198<br />
- profit and loss of the period (+/-) 1,702,325 4,011,788<br />
- capital gains/losses on financial assets/liabilities held for trading and<br />
on assets/liabilities designated at fair value through profit and loss (+/-) (177,584) 1,205,978<br />
- capital gains/losses on hedging operations (+/-) (23,761) (16,685)<br />
- net write-offs/write-backs due to impairment (+/-) 7,821,457 3,012,576<br />
- net write-offs/write-backs on tangible and intangible assets (+/-) 1,556,507 2,367,433<br />
- provisions and other incomes/expenses (+/-) 466,522 617,243<br />
- not cashed net premiums (-) 3,176 2,971<br />
- other not collected incomes and expenses from insurance activities (10,817) (4,345)<br />
- not paied tax (+) 481,821 (160,384)<br />
- other adjustments (+) 213,799 (390,377)<br />
2. Liquiditygenerated/absorbed by financial assets 111,477,328 (36,798,417)<br />
- financial assets held for trading 72,254,689 (3,242,313)<br />
- financial assets at fair value 1,019,387 (1,360,205)<br />
- available-for-sale financial assets (5,684,399) (1,709,914)<br />
- loans and receivables with banks 1,517,802 17,523,068<br />
- loans and receivables with customers 39,705,891 (47,332,783)<br />
- other assets 2,663,958 (676,270)<br />
3. Liquidity generated/absorbed by financial liabilities (127,494,318) 32,658,475<br />
- deposits from banks (72,318,209) 18,093,010<br />
- deposits from customers (4,547,126) 5,173,161<br />
- debt certificates including bonds 10,921,841 (37,725,937)<br />
- financial liabilities held for trading (51,323,180) 51,988,395<br />
- financial liabilities designated at fair value (46,669) (304,254)<br />
- other liabilities (10,180,975) (4,565,900)<br />
Net liquidity generated/absorbed by operating activities (3,983,545) 6,506,256<br />
B. INVESTMENT ACTIVITIES<br />
1. Liquidity generated by: 12,280,943 10,463,504<br />
- sales of equity investments 70,904 706,048<br />
- collected dividends on equity investments 89,678 222,652<br />
- sales of financial assets held to maturity 10,571,734 6,719,820<br />
- sales of tangible assets 1,138,777 662,702<br />
- sales of intangible assets 15,725 169,037<br />
- sales of subsidiaries and divisions 394,125 1,983,245<br />
2. Liquidity absorbed by: (6,642,338) (16,233,246)<br />
- purchases of equity investments (164,218) (573,035)<br />
- purchases of financial assets held to maturity (4,396,484) (12,157,523)<br />
- purchases of tangible assets (1,634,432) (1,486,692)<br />
- purchases of intangible assets (447,204) (410,016)<br />
- purchases of subsidiaries and divisions - (1,605,980)<br />
Net liquiditygenerated/absorbed by investment activities 5,638,605 (5,769,742)<br />
C. FUNDING ACTIVITIES<br />
- issue/purchase of treasury shares 2,798,998 (221,551)<br />
- distribution of dividends and other scopes (7,067) (3,443,413)<br />
Net liquiditygenerated/absorbed by funding activities 2,791,931 (3,664,964)<br />
NET LIQUIDITY GENERATED/ABSORBED DURING THE YEAR 4,446,991 (2,928,450)<br />
KEY: (+) generated ; (-) absorbed<br />
RECONCILIATION 2009 2008<br />
Cash and cash equivalents at the beginning of the year 7,652,446 11,072,942<br />
Net liquidity generated/absorbed during the year 4,446,991 (2,928,450)<br />
Cash and cash equivalents: effect of exchange rate variations (112,640) (492,046)<br />
Cash and cash equivalents at the end of the year 11,986,797 7,652,446