GENERAL MEETING DRAFT - Bankier.pl
GENERAL MEETING DRAFT - Bankier.pl
GENERAL MEETING DRAFT - Bankier.pl

Create successful ePaper yourself
Turn your PDF publications into a flip-book with our unique Google optimized e-Paper software.
�������� � � ���� ���������� �� ����� � ���� ��<br />
277<br />
>> Consolidated Financial Statements<br />
Part B – Consolidated Balance Sheet – Liabilities<br />
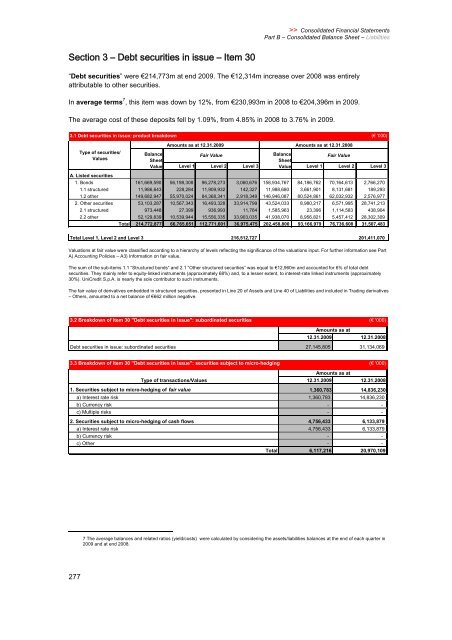
“Debt securities” were�214,773m at end 2009. The �12,314m increase over 2008 was entirely<br />
attributable to other securities.<br />
In average terms 7 , this item was down by 12%, from �230,993m in 2008 to �204,396m in 2009.<br />
The average cost of these deposits fell by 1.09%, from 4.85% in 2008 to 3.76% in 2009.<br />
3.1 Debt securities in issue: product breakdown (� '000)<br />
Amounts as at 12.31.2009<br />
Amounts as at 12.31.2008<br />
Type of securities/<br />
Values<br />
Balance<br />
Sheet<br />
Fair Value Balance<br />
Sheet<br />
Fair Value<br />
Value Level1 Level2 Level3 Value Level1 Level2 Level3<br />
A. Listed securities<br />
1. Bonds 161,669,590 56,198,308 96,278,273 3,060,676 158,934,767 84,186,762 70,164,613 2,766,270<br />
1.1 structured 11,986,643 228,284 11,909,932 142,327 11,988,680 3,661,901 8,131,681 189,293<br />
1.2 other 149,682,947 55,970,024 84,368,341 2,918,349 146,946,087 80,524,861 62,032,932 2,576,977<br />
2. Other securities 53,103,287 10,567,343 16,493,328 33,914,799 43,524,033 8,980,217 6,571,995 28,741,213<br />
2.1 structured 973,448 27,399 936,993 11,764 1,585,963 23,396 1,114,583 438,904<br />
2.2 other 52,129,839 10,539,944 15,556,335 33,903,035 41,938,070 8,956,821 5,457,412 28,302,309<br />
Total 214,772,877 66,765,651 112,771,601 36,975,475 202,458,800 93,166,979 76,736,608 31,507,483<br />
Total Level 1, Level 2 and Level 3 216,512,727 201,411,070<br />
Valuations at fair value were classified according to a hierarchy of levels reflecting the significance of the valuations input. For further information see Part<br />
A) Accounting Policies – A3) Information on fair value.<br />
The sum of the sub-items 1.1 “Structured bonds” and 2.1 “Other structured securities” was equal to �12,960m and accounted for 6% of total debt<br />
securities. They mainly refer to equity-linked instruments (approximately 68%) and, to a lesser extent, to interest-rate linked instruments (approximately<br />
30%). UniCredit S.p.A. is nearly the sole contributor to such instruments.<br />
The fair value of derivatives embedded in structured securities, presented in Line 20 of Assets and Line 40 of Liabilities and included in Trading derivatives<br />
– Others, amounted to a net balance of �662 million negative.<br />
3.2 Breakdown of item 30 "Debt securities in issue": subordinated securities (� '000)<br />
Amountsasat<br />
12.31.2009 12.31.2008<br />
Debt securities in issue: subordinated securities 27,145,805 31,134,069<br />
3.3 Breakdown of item 30 "Debt securities in issue": securities subject to micro-hedging (� '000)<br />
Type of transactions/Values<br />
Amounts as at<br />
12.31.2009 12.31.2008<br />
1. Securities subject to micro-hedging of fair value 1,360,783 14,836,230<br />
a) Interest rate risk 1,360,783 14,836,230<br />
b) Currency risk - -<br />
c) Multi<strong>pl</strong>e risks - -<br />
2. Securities subject to micro-hedging of cash flows 4,756,433 6,133,879<br />
a) Interest rate risk 4,756,433 6,133,879<br />
b) Currency risk - -<br />
c) Other - -<br />
Total 6,117,216 20,970,109<br />
7 The average balances and related ratios (yield/costs) were calculated by considering the assets/liabilities balances at the end of each quarter in<br />
2009 and at end 2008.