6.1 Loans and receivables with banks: product breakdown (� '000) Type of transactions/Values 2009 CONSOLIDATED REPORTS AND ACCOUNTS Amounts as at 12.31.2009 12.31.2008 A. Loans to Central Banks 14,911,464 21,044,846 1. Time deposits 297,318 257,122 2. Compulsory reserves 13,033,177 17,608,180 3. Reverse repos 464,208 2,702,557 4. Other 1,116,761 476,987 B. Loans to Banks 63,357,973 59,782,106 1. Current accounts and demand deposits 16,754,153 15,749,139 2. Time deposits 9,927,313 13,801,674 3. Other loans 24,180,803 23,531,560 3.1 Reverse repos 14,989,550 10,854,627 3.2 Finance leases 2,524 4,998 3.3 Other 9,188,729 12,671,935 4. Debt securities 12,495,704 6,699,733 4.1 Structured - 480 4.2 Other 12,495,704 6,699,253 Total (carrying amount) 78,269,437 80,826,952 Total (Fair value ) 78,385,338 80,868,130 6.2 Loans and receivables with banks subject to micro-hedging (� '000) Type of transactions/Values Amounts as at 12.31.2009 12.31.2008 1. Loans and receivables subject to micro-hedging of fair value 757 73,713 a) interest rate risk - 67,938 b) currency risk - 5,306 c) credit risk - - d) multi<strong>pl</strong>e risks 757 469 2. Loans and receivables subject to micro-hedging of cash flows 70,914 104,390 a) interest rate risk 61,829 93,906 b) currency risk - - c) other 9,085 10,484 Total 71,671 178,103 6.3 Finance leases (� '000) Lessor Information Amounts as at 12.31.2009 Minimum Lease Payments Present value of minimum lease payments Amounts as at 12.31.2008 Minimum Lease Payments Present value of minimum lease payments Amounts receivable under finance leases: Up to 12 months 1,553 1,157 2,493 2,236 From 1 to 5 years 5,452 1,103 4,581 3,588 Later than 5 years 402 264 1,330 1,221 Total gross/net investment value of which: - Unguaranteed residual values of assets leased under 7,407 2,524 8,404 7,045 finance leases Less: unearned finance income (by remaining 830 825 954 948 maturity) (4,883) X (784) X Present value of minimum lease payments receivable (net investment in the lease) 2,524 2,524 7,620 7,045 242
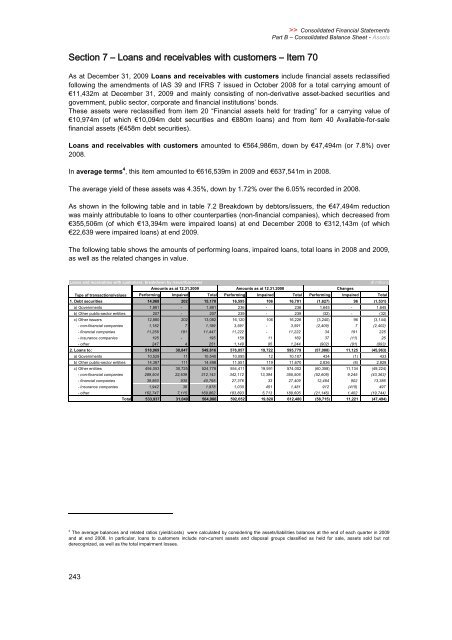
�������� � � ����� ��� ����������� ���� ��������� � ���� �� 243 >> Consolidated Financial Statements Part B – Consolidated Balance Sheet - Assets As at December 31, 2009 Loans and receivables with customers include financial assets reclassified following the amendments of IAS 39 and IFRS 7 issued in October 2008 for a total carrying amount of �11,432m at December 31, 2009 and mainly consisting of non-derivative asset-backed securities and government, public sector, corporate and financial institutions’ bonds. These assets were reclassified from item 20 “Financial assets held for trading” for a carrying value of �10,974m (of which �10,094m debt securities and �880m loans) and from item 40 Available-for-sale financial assets (�458m debt securities). Loans and receivables with customers amounted to �564,986m, down by �47,494m (or 7.8%) over 2008. In average terms 4 , this item amounted to �616,539m in 2009 and �637,541m in 2008. The average yield of these assets was 4.35%, down by 1.72% over the 6.05% recorded in 2008. As shown in the following table and in table 7.2 Breakdown by debtors/issuers, the �47,494m reduction was mainly attributable to loans to other counterparties (non-financial companies), which decreased from �355,506m (of which �13,394m were impaired loans) at end December 2008 to �312,143m (of which �22,639 were impaired loans) at end 2009. The following table shows the amounts of performing loans, impaired loans, total loans in 2008 and 2009, as well as the related changes in value. Loans and receivables with customers: breakdown by issuer/borrower (� million) Amounts as at 12.31.2009 Amounts as at 12.31.2008 Changes Type of transactions/values Performing Impaired Total Performing Impaired Total Performing Impaired Total 1. Debt securities 14,968 202 15,170 16,595 106 16,701 (1,627) 96 (1,531) a) Governments 1,881 - 1,881 236 - 236 1,645 - 1,645 b) Other public-sector entities 207 - 207 239 - 239 (32) - (32) c) Other issuers 12,880 202 13,082 16,120 106 16,226 (3,240) 96 (3,144) - non-financial companies 1,182 7 1,189 3,591 - 3,591 (2,409) 7 (2,402) - financial companies 11,256 191 11,447 11,222 - 11,222 34 191 225 - insurance companies 195 - 195 158 11 169 37 (11) 26 - other 247 4 251 1,149 95 1,244 (902) (91) (993) 2. Loans to: 518,969 30,847 549,816 576,057 19,722 595,779 (57,088) 11,125 (45,963) a) Governments 10,529 11 10,540 10,095 12 10,107 434 (1) 433 b) Other public-sector entities 14,387 111 14,498 11,551 119 11,670 2,836 (8) 2,828 c) Other entities 494,053 30,725 524,778 554,411 19,591 574,002 (60,358) 11,134 (49,224) - non-financial companies 289,504 22,639 312,143 342,112 13,394 355,506 (52,608) 9,245 (43,363) - financial companies 39,860 935 40,795 27,376 33 27,409 12,484 902 13,386 - Insurance companies 1,942 36 1,978 1,030 451 1,481 912 (415) 497 - other 162,747 7,115 169,862 183,893 5,713 189,606 (21,146) 1,402 (19,744) Total 533,937 31,049 564,986 592,652 19,828 612,480 (58,715) 11,221 (47,494) 4 The average balances and related ratios (yield/costs) were calculated by considering the assets/liabilities balances at the end of each quarter in 2009 and at end 2008. In particular, loans to customers include non-current assets and disposal groups classified as held for sale, assets sold but not derecognized, as well as the total impairment losses.
- Page 1 and 2:
2009 Consolidated Reports and Accou
- Page 3 and 4:
UniCredit S.p.A Registered Office:
- Page 5:
Contents 5 Introduction 7 Board of
- Page 9 and 10:
�����������
- Page 11 and 12:
11 >> Strategy and Results Our appr
- Page 13 and 14:
REVENUES BY REGION 4 (%) 24.4 7.7 1
- Page 15 and 16:
CENTRAL AND EASTERN EUROPE UniCredi
- Page 17:
Today’s UniCredit Group is a youn
- Page 20 and 21:
�����������
- Page 22 and 23:
�����������
- Page 24 and 25:
� ����������
- Page 26:
�����������
- Page 30 and 31:
����������� I
- Page 32 and 33:
�����������
- Page 34 and 35:
�����������
- Page 36 and 37:
�����������
- Page 38 and 39:
�����������
- Page 40 and 41:
�����������
- Page 42 and 43:
�����������
- Page 44 and 45:
�����������
- Page 46 and 47:
30 20 10 0 -10 -20 Operating Profit
- Page 48 and 49:
�����������
- Page 50 and 51:
�����������
- Page 52 and 53:
�����������
- Page 54 and 55:
�����������
- Page 56 and 57:
�����������
- Page 58 and 59:
�����������
- Page 60 and 61:
With the aim of creating shareholde
- Page 62 and 63:
SRT (Semplice Risparmiare Tempo - I
- Page 64 and 65:
�����������
- Page 66 and 67:
On the mortgage loans side, the Mut
- Page 68 and 69:
�����������
- Page 70 and 71:
Breakdown of loans by country and d
- Page 72 and 73:
�������� Within the
- Page 74 and 75:
�����������
- Page 76 and 77:
The new organizational model is bei
- Page 78 and 79:
Total Financial Assets (billion €
- Page 80 and 81:
Despite the decline in profit befor
- Page 82 and 83:
customer relation and the products
- Page 84 and 85:
This decrease was offset in part by
- Page 86 and 87:
�����������
- Page 88 and 89:
�����������
- Page 90 and 91:
Key Ratios and Indicators CENTRAL E
- Page 92 and 93:
������� In the diffic
- Page 94 and 95:
�������� Despite a
- Page 96 and 97:
UniCredit Bulbank is Bulgaria's lar
- Page 98 and 99:
�����������
- Page 100 and 101:
�����������
- Page 102 and 103:
�����������
- Page 104 and 105:
�������� Workout sa
- Page 106 and 107:
�����������
- Page 108 and 109:
2009 saw a strengthening of technol
- Page 110 and 111:
�����������
- Page 112 and 113:
capital of Bank Austria Aktiengesel
- Page 114 and 115:
Following the described operation,
- Page 116 and 117:
�����������
- Page 118 and 119:
�����������
- Page 120 and 121:
�����������
- Page 122 and 123:
�����������
- Page 124 and 125:
124
- Page 126 and 127:
�����������
- Page 128 and 129:
�����������
- Page 130 and 131:
D. examine the information received
- Page 132 and 133:
�����������
- Page 134 and 135:
Deputy Vice Chairman Gutty Gianfran
- Page 136 and 137:
�����������
- Page 138 and 139:
Corporate Governance Management Com
- Page 140 and 141:
����� ������
- Page 142 and 143:
Paolo Iannone Chief Operating Offic
- Page 144 and 145:
ASSET MANAGEMENT - EXECUTIVE VICE P
- Page 146 and 147:
146
- Page 148 and 149:
148
- Page 150 and 151:
Consolidated Balance Sheet Balance
- Page 152 and 153:
Consolidated Income Statement (�
- Page 154 and 155:
Statement of Changes in Shareholder
- Page 156 and 157:
2009 CONSOLIDATED REPORTS AND ACCOU
- Page 158 and 159:
158
- Page 160 and 161:
160
- Page 162 and 163:
���� � � ����
- Page 164 and 165:
The income statement was also chang
- Page 166 and 167:
The list of subsidiaries also inclu
- Page 168 and 169:
NAME MAIN OFFICE 22 ARNO GRUNDSTUCK
- Page 170 and 171:
NAME MAIN OFFICE 95 BANK AUSTRIA LE
- Page 172 and 173:
2009 CONSOLIDATED REPORTS AND ACCOU
- Page 174 and 175:
NAME MAIN OFFICE 2009 CONSOLIDATED
- Page 176 and 177:
2009 CONSOLIDATED REPORTS AND ACCOU
- Page 178 and 179:
2009 CONSOLIDATED REPORTS AND ACCOU
- Page 180 and 181:
2009 CONSOLIDATED REPORTS AND ACCOU
- Page 182 and 183:
2009 CONSOLIDATED REPORTS AND ACCOU
- Page 184 and 185:
NAME MAIN OFFICE 2009 CONSOLIDATED
- Page 186 and 187:
2009 CONSOLIDATED REPORTS AND ACCOU
- Page 188 and 189:
2009 CONSOLIDATED REPORTS AND ACCOU
- Page 190 and 191:
2009 CONSOLIDATED REPORTS AND ACCOU
- Page 192 and 193: Change of the consolidation method
- Page 194 and 195: The following table shows the Entit
- Page 196 and 197: The European Commission also transp
- Page 198 and 199: ��� � ��� ���
- Page 200 and 201: If however the fall in the fair val
- Page 202 and 203: The amount of the loss on impaired
- Page 204 and 205: Allowances for unsecured loans to r
- Page 206 and 207: transferred through profit or loss
- Page 208 and 209: Subsequent costs are added to the c
- Page 210 and 211: Goodwill is recognised at cost less
- Page 212 and 213: This method distributes the cost of
- Page 214 and 215: ��� � �������
- Page 216 and 217: The acquisition date is the date on
- Page 218 and 219: The lessee acquires the economic be
- Page 220 and 221: Guarantees and credit derivatives i
- Page 222 and 223: Objective evidence that a financial
- Page 224 and 225: ��� � �������
- Page 226 and 227: A.3.1.1 Reclassified financial asse
- Page 228 and 229: ��������� ��
- Page 230 and 231: ������ ��� ��
- Page 232 and 233: 232
- Page 234 and 235: ���� � � ����
- Page 236 and 237: 2.2 Financial assets held for tradi
- Page 238 and 239: �������� � �
- Page 240 and 241: �������� � �
- Page 244 and 245: The following table shows the perce
- Page 246 and 247: �������� � �
- Page 248 and 249: NAME MAIN OFFICE 2009 CONSOLIDATED
- Page 250 and 251: Name 2009 CONSOLIDATED REPORTS AND
- Page 252 and 253: �������� �� �
- Page 254 and 255: 12.3 Property, plant and equipment
- Page 256 and 257: �������� �� �
- Page 258 and 259: Core Deposits The value of the rela
- Page 260 and 261: In accordance with the provisions o
- Page 262 and 263: Utility value is determined by disc
- Page 264 and 265: Non-CEE countries: Rates 2009 2010
- Page 266 and 267: Discount rates of flows The table b
- Page 268 and 269: Supplementing the sensitivity analy
- Page 270 and 271: 14.3 Deferred tax assets: annual ch
- Page 272 and 273: �������� �� �
- Page 274 and 275: �����������
- Page 276 and 277: 2.3 Breakdown of item 20 "Deposits
- Page 278 and 279: �������� � �
- Page 280 and 281: �������� � �
- Page 282 and 283: �������� �� �
- Page 284 and 285: 3. Changes to plan assets and other
- Page 286 and 287: The table below shows the breakdown
- Page 288 and 289: 15.2 Capital Stock - number of shar
- Page 290 and 291: ����� ������
- Page 292 and 293:
292
- Page 294 and 295:
���� � � ����
- Page 296 and 297:
1.4 Interest expense and similar ch
- Page 298 and 299:
Fee and commission expense fell fro
- Page 300 and 301:
������� � � �
- Page 302 and 303:
�������� � �
- Page 304 and 305:
������� � � �
- Page 306 and 307:
������� �� �
- Page 308 and 309:
11.5 Other administrative expenses:
- Page 310 and 311:
������� �� �
- Page 312 and 313:
������� �� �
- Page 314 and 315:
������� �� �
- Page 316 and 317:
������� �� �
- Page 318 and 319:
318
- Page 320 and 321:
2009 CONSOLIDATED REPORTS AND ACCOU
- Page 322 and 323:
322
- Page 324 and 325:
���� � � ����
- Page 326 and 327:
With regard to the use of the AMA (
- Page 328 and 329:
During the first quarter of 2009, c
- Page 330 and 331:
2.2.1 Country risk Country risk is
- Page 332 and 333:
The assessment of a counterpart’s
- Page 334 and 335:
Credit risk strategies are defined
- Page 336 and 337:
The current models in place within
- Page 338 and 339:
�����������
- Page 340 and 341:
A.1.3 Banking group - On- and off-b
- Page 342 and 343:
A.2 Internal and external ratings A
- Page 344 and 345:
A.3 Distribution of secured credit
- Page 346 and 347:
�� ���������
- Page 348 and 349:
B.3 Banking Group -Distribution of
- Page 350 and 351:
The Group is also an investor, spon
- Page 352 and 353:
ORIGINATOR: UniCredit S.p.A. (ex Ca
- Page 354 and 355:
New transaction 2009 NAME Type of s
- Page 356 and 357:
ORIGINATOR: UniCredit Family Financ
- Page 358 and 359:
ORIGINATOR: UniCredit Leasing S.p.A
- Page 360 and 361:
ORIGINATOR: Leasfinanz GmbH Transac
- Page 362 and 363:
New transaction 2009 NAME Type of s
- Page 364 and 365:
Transactions previous periods NAME
- Page 366 and 367:
ORIGINATOR: UNICREDIT BANK AG (ex H
- Page 368 and 369:
ORIGINATOR: UNICREDIT BANK AG (ex H
- Page 370 and 371:
ORIGINATOR: UNICREDIT BANK AG (ex H
- Page 372 and 373:
ORIGINATOR: UNICREDIT BANK AG (ex H
- Page 374 and 375:
ORIGINATOR: UNICREDIT BANK AUSTRIA
- Page 376 and 377:
C.1.2 Banking Group - Exposure from
- Page 378 and 379:
( C.1.2 Banking Group - Exposure fr
- Page 380 and 381:
(C.1.3 Banking Group - Exposure res
- Page 382 and 383:
C.1.4 Banking Group - Exposure resu
- Page 384 and 385:
attachment to table C.1.8 STATEMENT
- Page 386 and 387:
Eurofinance 2000 S.r.L. - Patrimoni
- Page 388 and 389:
Geldilux TS 2005 S.A. 31/12/2009 31
- Page 390 and 391:
Geldilux TS 2008 S.A. 31/12/2009 31
- Page 392 and 393:
Trevi Finance S.p.A. 31/12/2009 31/
- Page 394 and 395:
Trevi Finance n. 3 S.r.L. 31/12/200
- Page 396 and 397:
C.3 Covered Bond Transactions Quali
- Page 398 and 399:
1. Structured Credit Products A det
- Page 400 and 401:
The transactions included under “
- Page 402 and 403:
In some circumstances purchase comp
- Page 404 and 405:
Over 55% of the structured credit p
- Page 406 and 407:
A breakdown of the Group’s gross
- Page 408 and 409:
Structured credit product exposures
- Page 410 and 411:
The following table shows the main
- Page 412 and 413:
Where it is impossible to identify
- Page 414 and 415:
2. OTC Trading Derivatives with Cus
- Page 416 and 417:
�������� � �
- Page 418 and 419:
In the same way, and in an effort t
- Page 420 and 421:
The following table gives the VaR f
- Page 422 and 423:
The main sources of interest rate r
- Page 424 and 425:
1.1 Banking portfolio: distribution
- Page 426 and 427:
1.3 Banking portfolio: distribution
- Page 428 and 429:
��� ��������
- Page 430 and 431:
A.2.2 Banking book: end of period n
- Page 432 and 433:
A.6 OTC Financial Derivatives: Regu
- Page 434 and 435:
B.2 Credit derivatives:gross positi
- Page 436 and 437:
For each 1bp shift, sensitivity is
- Page 438 and 439:
Exchange-Rate Sensitivity This simu
- Page 440 and 441:
Stress Tests Stress Tests complemen
- Page 442 and 443:
������� � � �
- Page 444 and 445:
The liquidity metrics The Group’s
- Page 446 and 447:
Additional liquidity risk measures
- Page 448 and 449:
Early Warning Indicators The Early
- Page 450 and 451:
1.3 Time breakdown by contractual r
- Page 452 and 453:
The mission of the Group Operationa
- Page 454 and 455:
�� ����� ����
- Page 456 and 457:
The Special Representative submitte
- Page 458 and 459:
Defendants include - inter alia - t
- Page 460 and 461:
On October 2, 2009, the receivershi
- Page 462 and 463:
d.d. never occurred. Therefore, Zag
- Page 464 and 465:
Shareholders’ Meeting of October
- Page 466 and 467:
The officers involved in the procee
- Page 468 and 469:
Several subsidiaries of UniCredit S
- Page 470 and 471:
Madoff In October 2009, the Souther
- Page 472 and 473:
������� � � �
- Page 474 and 475:
Internal Capital is then broken dow
- Page 476 and 477:
476
- Page 478 and 479:
���� � � ����
- Page 480 and 481:
�� ���������
- Page 482 and 483:
��� ������� �
- Page 484 and 485:
��� ������� �
- Page 486 and 487:
486
- Page 488 and 489:
���� � � ����
- Page 490 and 491:
490
- Page 492 and 493:
���� � � ����
- Page 494 and 495:
The following table sets out the im
- Page 496 and 497:
496
- Page 498 and 499:
���� � � ����
- Page 500 and 501:
Within the limits of the “Employe
- Page 502 and 503:
The ESOP 2009 is a share plan simil
- Page 504 and 505:
504
- Page 506 and 507:
���� � � ����
- Page 508 and 509:
� � ������� �
- Page 510 and 511:
� � ���������
- Page 512 and 513:
512
- Page 514 and 515:
����� � � ���
- Page 516 and 517:
CONSOLIDATED INCOME STATEMENT (�
- Page 518 and 519:
����� � � ���
- Page 520 and 521:
Annex 3 AMMS ERSATZ-KOMPLEMENTAR GM
- Page 522 and 523:
Annex 3 BALEA SOFT HAMBURG GERMANY
- Page 524 and 525:
Annex 3 BOSTON CAPITAL VENTURES V,
- Page 526 and 527:
CHARME INVESTMENTS S.C.A. LUXEMBOUR
- Page 528 and 529:
CO. WINDPARK MOSE KG Annex 3 68.48
- Page 530 and 531:
Annex 3 GUS CONSULTING GMBH VIENNA
- Page 532 and 533:
HVB LIFE SCIENCE GMBH MUNICH GERMAN
- Page 534 and 535:
Annex 3 INFORMATIONS-TECHNOLOGIE AU
- Page 536 and 537:
LIVA IMMOBILIEN LEASING VIENNA AUST
- Page 538 and 539:
Annex 3 OBEROSTERREICHISCHE UNTERNE
- Page 540 and 541:
PIONEER INVESTMENTS MUNICH GERMANY
- Page 542 and 543:
Annex 3 SANITA' - SRL IN LIQUIDAZIO
- Page 544 and 545:
TERRENO GRUNDSTUCKSVERWALTUNG GMBH
- Page 546 and 547:
Annex 3 … … UNICREDIT CORPORATE
- Page 548 and 549:
Annex 3 UNICREDIT PARTNER D.O.O ZAG
- Page 550 and 551:
Annex 3 VV IMMOBILIEN GMBH & CO. GB
- Page 552 and 553:
����� � � ���
- Page 554 and 555:
Basel 2 New international capital a
- Page 556 and 557:
Consumer ABS ABS (q.v.) in which th
- Page 558 and 559:
FINREP Document issued by the Commi
- Page 560 and 561:
IRS - Interest Rate Swap See "Swap"
- Page 562 and 563:
Operating risk The risk of losses d
- Page 564 and 565:
Securitization Transfer of a portfo
- Page 566 and 567:
566
- Page 568 and 569:
568
- Page 570:
570