GENERAL MEETING DRAFT - Bankier.pl
GENERAL MEETING DRAFT - Bankier.pl
GENERAL MEETING DRAFT - Bankier.pl

You also want an ePaper? Increase the reach of your titles
YUMPU automatically turns print PDFs into web optimized ePapers that Google loves.
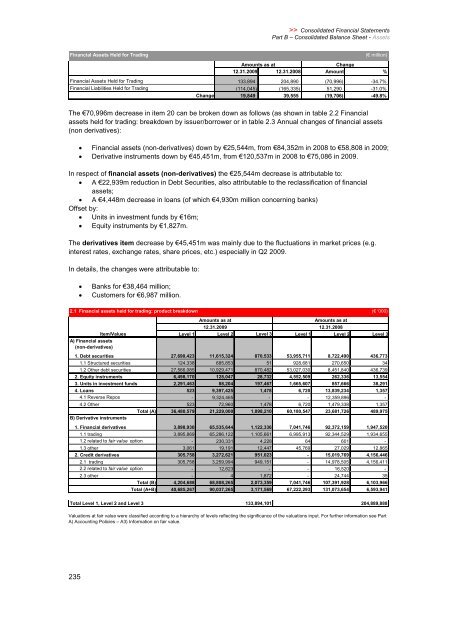
Financial Assets Held for Trading<br />
235<br />
>> Consolidated Financial Statements<br />
Part B – Consolidated Balance Sheet - Assets<br />
(� million)<br />
Amounts as at<br />
Change<br />
12.31.2009 12.31.2008 Amount %<br />
Financial Assets Held for Trading 133,894 204,890 (70,996) -34.7%<br />
Financial Liabilities Held for Trading (114,045) (165,335) 51,290 -31.0%<br />
Change 19,849 39,555 (19,706) -49.8%<br />
The �70,996m decrease in item 20 can be broken down as follows (as shown in table 2.2 Financial<br />
assets held for trading: breakdown by issuer/borrower or in table 2.3 Annual changes of financial assets<br />
(non derivatives):<br />
� Financial assets (non-derivatives) down by �25,544m, from �84,352m in 2008 to �58,808 in 2009;<br />
� Derivative instruments down by �45,451m, from �120,537m in 2008 to �75,086 in 2009.<br />
In respect of financial assets (non-derivatives) the �25,544m decrease is attributable to:<br />
� A �22,939m reduction in Debt Securities, also attributable to the reclassification of financial<br />
assets;<br />
� A �4,448m decrease in loans (of which �4,930m million concerning banks)<br />
Offset by:<br />
� Units in investment funds by �16m;<br />
� Equity instruments by �1,827m.<br />
The derivatives item decrease by �45,451m was mainly due to the fluctuations in market prices (e.g.<br />
interest rates, exchange rates, share prices, etc.) especially in Q2 2009.<br />
In details, the changes were attributable to:<br />
� Banks for �38,464 million;<br />
� Customers for �6,987 million.<br />
2.1 Financial assets held for trading: product breakdown (� '000)<br />
Amounts as at Amounts as at<br />
12.31.2009 12.31.2008<br />
Item/Values<br />
A) Financial assets<br />
(non-derivatives)<br />
Level1 Level2 Level 3 Level 1 Level 2 Level 3<br />
1. Debt securities 27,690,423 11,615,324 870,533 53,955,711 8,722,490 436,773<br />
1.1 Structured securities 124,338 685,853 51 928,681 270,650 34<br />
1.2 Other debt securities 27,566,085 10,929,471 870,482 53,027,030 8,451,840 436,739<br />
2. Equity instruments 6,498,170 128,047 28,732 4,552,509 262,336 13,554<br />
3. Units in investment funds 2,291,463 88,204 197,467 1,665,607 857,666 38,291<br />
4. Loans 523 9,397,425 1,478 6,720 13,839,234 1,357<br />
4.1 Reverse Repos - 9,324,465 - - 12,359,896 -<br />
4.2 Other 523 72,960 1,478 6,720 1,479,338 1,357<br />
Total (A)<br />
B) Derivative instruments<br />
36,480,579 21,229,000 1,098,210 60,180,547 23,681,726 489,975<br />
1. Financial derivatives 3,898,930 65,535,644 1,122,336 7,041,746 92,372,159 1,947,520<br />
1.1 trading 3,895,869 65,286,122 1,105,661 6,995,913 92,344,529 1,934,655<br />
1.2 related to fair value option - 230,331 4,228 64 601 -<br />
1.3 other 3,061 19,191 12,447 45,769 27,029 12,865<br />
2. Credit derivatives 305,758 3,272,621 951,023 - 15,019,769 4,156,446<br />
2.1 trading 305,758 3,259,994 949,151 - 14,978,505 4,156,411<br />
2.2 related to fair value option - 12,623 - - 16,520 -<br />
2.3 other - 4 1,872 - 24,744 35<br />
Total (B) 4,204,688 68,808,265 2,073,359 7,041,746 107,391,928 6,103,966<br />
Total (A+B) 40,685,267 90,037,265 3,171,569 67,222,293 131,073,654 6,593,941<br />
Total Level 1, Level 2 and Level 3 133,894,101 204,889,888<br />
Valuations at fair value were classified according to a hierarchy of levels reflecting the significance of the valuations input. For further information see Part<br />
A) Accounting Policies – A3) Information on fair value.