1996 Electronics Industry Environmental Roadmap - Civil and ...
1996 Electronics Industry Environmental Roadmap - Civil and ...
1996 Electronics Industry Environmental Roadmap - Civil and ...
Create successful ePaper yourself
Turn your PDF publications into a flip-book with our unique Google optimized e-Paper software.
Appendix D<br />
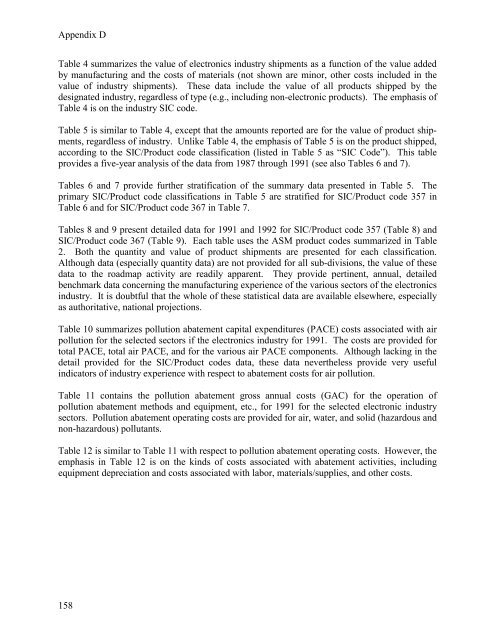
Table 4 summarizes the value of electronics industry shipments as a function of the value added<br />
by manufacturing <strong>and</strong> the costs of materials (not shown are minor, other costs included in the<br />
value of industry shipments). These data include the value of all products shipped by the<br />
designated industry, regardless of type (e.g., including non-electronic products). The emphasis of<br />
Table 4 is on the industry SIC code.<br />
Table 5 is similar to Table 4, except that the amounts reported are for the value of product shipments,<br />
regardless of industry. Unlike Table 4, the emphasis of Table 5 is on the product shipped,<br />
according to the SIC/Product code classification (listed in Table 5 as “SIC Code”). This table<br />
provides a five-year analysis of the data from 1987 through 1991 (see also Tables 6 <strong>and</strong> 7).<br />
Tables 6 <strong>and</strong> 7 provide further stratification of the summary data presented in Table 5. The<br />
primary SIC/Product code classifications in Table 5 are stratified for SIC/Product code 357 in<br />
Table 6 <strong>and</strong> for SIC/Product code 367 in Table 7.<br />
Tables 8 <strong>and</strong> 9 present detailed data for 1991 <strong>and</strong> 1992 for SIC/Product code 357 (Table 8) <strong>and</strong><br />
SIC/Product code 367 (Table 9). Each table uses the ASM product codes summarized in Table<br />
2. Both the quantity <strong>and</strong> value of product shipments are presented for each classification.<br />
Although data (especially quantity data) are not provided for all sub-divisions, the value of these<br />
data to the roadmap activity are readily apparent. They provide pertinent, annual, detailed<br />
benchmark data concerning the manufacturing experience of the various sectors of the electronics<br />
industry. It is doubtful that the whole of these statistical data are available elsewhere, especially<br />
as authoritative, national projections.<br />
Table 10 summarizes pollution abatement capital expenditures (PACE) costs associated with air<br />
pollution for the selected sectors if the electronics industry for 1991. The costs are provided for<br />
total PACE, total air PACE, <strong>and</strong> for the various air PACE components. Although lacking in the<br />
detail provided for the SIC/Product codes data, these data nevertheless provide very useful<br />
indicators of industry experience with respect to abatement costs for air pollution.<br />
Table 11 contains the pollution abatement gross annual costs (GAC) for the operation of<br />
pollution abatement methods <strong>and</strong> equipment, etc., for 1991 for the selected electronic industry<br />
sectors. Pollution abatement operating costs are provided for air, water, <strong>and</strong> solid (hazardous <strong>and</strong><br />
non-hazardous) pollutants.<br />
Table 12 is similar to Table 11 with respect to pollution abatement operating costs. However, the<br />
emphasis in Table 12 is on the kinds of costs associated with abatement activities, including<br />
equipment depreciation <strong>and</strong> costs associated with labor, materials/supplies, <strong>and</strong> other costs.<br />
158


