2. Mangatawa catchment consents for earthworks, storm water ...
2. Mangatawa catchment consents for earthworks, storm water ...
2. Mangatawa catchment consents for earthworks, storm water ...
- No tags were found...

Create successful ePaper yourself
Turn your PDF publications into a flip-book with our unique Google optimized e-Paper software.
<strong>2.</strong>2 Hydrological Assessment<br />
<strong>2.</strong><strong>2.</strong>1 Catchments<br />
The Papamoa Hills area is the major <strong>catchment</strong> contributing to the <strong>Mangatawa</strong> Drain runoff; see<br />
Appendix A <strong>for</strong> the illustration of the <strong>catchment</strong> boundaries. The southern rural <strong>catchment</strong>s flow<br />
directly into the drain and thence without treatment into the harbour, at Rangataua Bay. The<br />
northern (urban) <strong>catchment</strong> drains into the Maranui swale and is treated in the Maranui Pond be<strong>for</strong>e<br />
also discharging to Rangataua Bay. The current SH2 runoff is partly to the <strong>Mangatawa</strong> drain, and<br />
partly to the Maranui swale. For the proposed TEM this will change, with both the southern and<br />
northern carriageway draining into the Maranui swale and being treated in the Maranui Pond.<br />
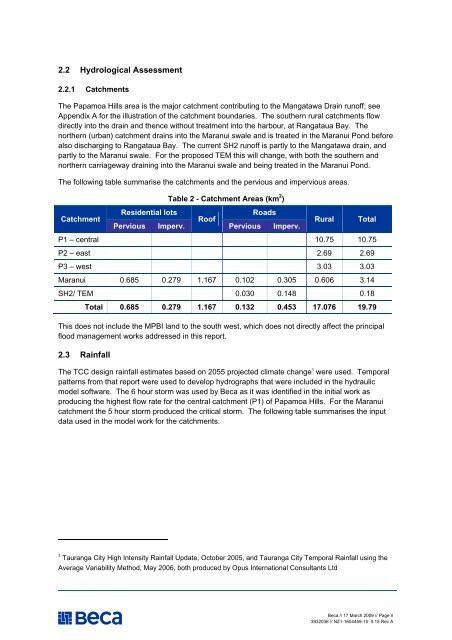
The following table summarise the <strong>catchment</strong>s and the pervious and impervious areas.<br />
Table 2 - Catchment Areas (km 2 )<br />
Catchment<br />
Residential lots<br />
Pervious Imperv.<br />
Roof<br />
Roads<br />
Pervious Imperv.<br />
Rural<br />
Total<br />
P1 – central Lots 10.75 10.75<br />
P2 – east <strong>2.</strong>69 <strong>2.</strong>69<br />
P3 – west 3.03 3.03<br />
Maranui 0.685 0.279 1.167 0.102 0.305 0.606 3.14<br />
SH2/ TEM 0.030 0.148 0.18<br />
Total 0.685 0.279 1.167 0.132 0.453 17.076 19.79<br />
This does not include the MPBI land to the south west, which does not directly affect the principal<br />
flood management works addressed in this report.<br />
<strong>2.</strong>3 Rainfall<br />
The TCC design rainfall estimates based on 2055 projected climate change 3 were used. Temporal<br />
patterns from that report were used to develop hydrographs that were included in the hydraulic<br />
model software. The 6 hour <strong>storm</strong> was used by Beca as it was identified in the initial work as<br />
producing the highest flow rate <strong>for</strong> the central <strong>catchment</strong> (P1) of Papamoa Hills. For the Maranui<br />
<strong>catchment</strong> the 5 hour <strong>storm</strong> produced the critical <strong>storm</strong>. The following table summarises the input<br />
data used in the model work <strong>for</strong> the <strong>catchment</strong>s.<br />
3 Tauranga City High Intensity Rainfall Update, October 2005, and Tauranga City Temporal Rainfall using the<br />
Average Variability Method, May 2006, both produced by Opus International Consultants Ltd<br />
Beca // 17 March 2009 // Page 8<br />
3932036 // NZ1-1604459-15 0.15 Rev A