2. Mangatawa catchment consents for earthworks, storm water ...
2. Mangatawa catchment consents for earthworks, storm water ...
2. Mangatawa catchment consents for earthworks, storm water ...
- No tags were found...

Create successful ePaper yourself
Turn your PDF publications into a flip-book with our unique Google optimized e-Paper software.
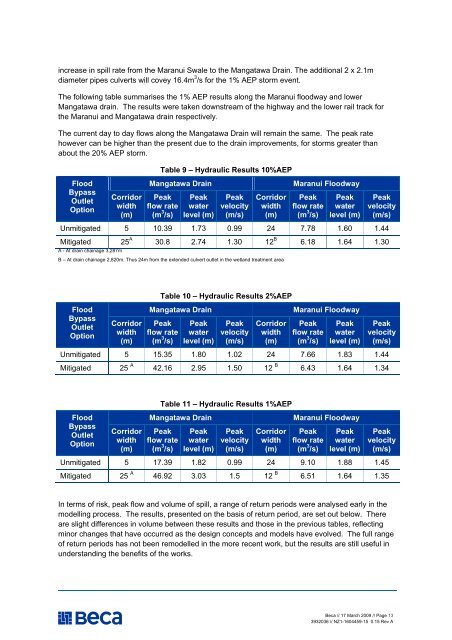
increase in spill rate from the Maranui Swale to the <strong>Mangatawa</strong> Drain. The additional 2 x <strong>2.</strong>1m<br />
diameter pipes culverts will covey 16.4m 3 /s <strong>for</strong> the 1% AEP <strong>storm</strong> event.<br />
The following table summarises the 1% AEP results along the Maranui floodway and lower<br />
<strong>Mangatawa</strong> drain. The results were taken downstream of the highway and the lower rail track <strong>for</strong><br />
the Maranui and <strong>Mangatawa</strong> drain respectively.<br />
The current day to day flows along the <strong>Mangatawa</strong> Drain will remain the same. The peak rate<br />
however can be higher than the present due to the drain improvements, <strong>for</strong> <strong>storm</strong>s greater than<br />
about the 20% AEP <strong>storm</strong>.<br />
Table 9 – Hydraulic Results 10%AEP<br />
Flood<br />
Bypass<br />
Outlet<br />
Option<br />
Corridor<br />
width<br />
(m)<br />
<strong>Mangatawa</strong> Drain<br />
Peak<br />
flow rate<br />
(m 3 /s)<br />
Peak<br />
<strong>water</strong><br />
level (m)<br />
Peak<br />
velocity<br />
(m/s)<br />
Corridor<br />
width<br />
(m)<br />
Maranui Floodway<br />
Peak<br />
flow rate<br />
(m 3 /s)<br />
Peak<br />
<strong>water</strong><br />
level (m)<br />
Peak<br />
velocity<br />
(m/s)<br />
Unmitigated 5 10.39 1.73 0.99 24 7.78 1.60 1.44<br />
Mitigated 25 A 30.8 <strong>2.</strong>74 1.30 12 B 6.18 1.64 1.30<br />
A - At drain chainage 3,287m<br />
B – At drain chainage 2,820m. Thus 24m from the extended culvert outlet in the wetland treatment area<br />
Table 10 – Hydraulic Results 2%AEP<br />
Flood<br />
Bypass<br />
Outlet<br />
Option<br />
Corridor<br />
width<br />
(m)<br />
<strong>Mangatawa</strong> Drain<br />
Peak<br />
flow rate<br />
(m 3 /s)<br />
Peak<br />
<strong>water</strong><br />
level (m)<br />
Peak<br />
velocity<br />
(m/s)<br />
Corridor<br />
width<br />
(m)<br />
Maranui Floodway<br />
Peak<br />
flow rate<br />
(m 3 /s)<br />
Peak<br />
<strong>water</strong><br />
level (m)<br />
Peak<br />
velocity<br />
(m/s)<br />
Unmitigated 5 15.35 1.80 1.02 24 7.66 1.83 1.44<br />
Mitigated 25 A 4<strong>2.</strong>16 <strong>2.</strong>95 1.50 12 B 6.43 1.64 1.34<br />
Table 11 – Hydraulic Results 1%AEP<br />
Flood<br />
Bypass<br />
Outlet<br />
Option<br />
Corridor<br />
width<br />
(m)<br />
<strong>Mangatawa</strong> Drain<br />
Peak<br />
flow rate<br />
(m 3 /s)<br />
Peak<br />
<strong>water</strong><br />
level (m)<br />
Peak<br />
velocity<br />
(m/s)<br />
Corridor<br />
width<br />
(m)<br />
Maranui Floodway<br />
Peak<br />
flow rate<br />
(m 3 /s)<br />
Peak<br />
<strong>water</strong><br />
level (m)<br />
Peak<br />
velocity<br />
(m/s)<br />
Unmitigated 5 17.39 1.82 0.99 24 9.10 1.88 1.45<br />
Mitigated 25 A 46.92 3.03 1.5 12 B 6.51 1.64 1.35<br />
In terms of risk, peak flow and volume of spill, a range of return periods were analysed early in the<br />
modelling process. The results, presented on the basis of return period, are set out below. There<br />
are slight differences in volume between these results and those in the previous tables, reflecting<br />
minor changes that have occurred as the design concepts and models have evolved. The full range<br />
of return periods has not been remodelled in the more recent work, but the results are still useful in<br />
understanding the benefits of the works.<br />
Beca // 17 March 2009 // Page 13<br />
3932036 // NZ1-1604459-15 0.15 Rev A