- Page 1 and 2:
Record Record 2010/23 2010/23 GeoCa
- Page 3 and 4:
Airborne Gravity 2010 Department of
- Page 5 and 6:
Airborne Gravity 2010 Acquisition a
- Page 7 and 8:
Airborne Gravity 2010 Images on the
- Page 9 and 10:
Airborne Gravity 2010 gravity gradi
- Page 11 and 12:
Airborne Gravity 2010 Figure 1. Det
- Page 13 and 14:
Airborne Gravity 2010 Even in the l
- Page 15 and 16:
Airborne Gravity 2010 In order to p
- Page 17 and 18:
Airborne Gravity 2010 Acknowledgeme
- Page 19 and 20:
Airborne Gravity 2010 Figure 1. Sud
- Page 21 and 22:
Airborne Gravity 2010 Figure 4. Ima
- Page 23 and 24:
Airborne Gravity 2010 Gravity inver
- Page 25 and 26:
Airborne Gravity 2010 thanked for c
- Page 27 and 28:
Airborne Gravity 2010 The data used
- Page 29 and 30:
Airborne Gravity 2010 the full calc
- Page 31 and 32:
Airborne Gravity 2010 error on Gzz
- Page 33 and 34:
Airborne Gravity 2010 A Turnkey Air
- Page 35 and 36:
Airborne Gravity 2010 The prototype
- Page 37 and 38:
Airborne Gravity 2010 aircraft flig
- Page 39 and 40:
Airborne Gravity 2010 Figure 9. Sys
- Page 41 and 42:
Airborne Gravity 2010 References Jo
- Page 43 and 44:
Airborne Gravity 2010 Figure 1. Fli
- Page 45 and 46:
Airborne Gravity 2010 Cryostat The
- Page 47 and 48:
Airborne Gravity 2010 Figure 5. Com
- Page 49 and 50:
Airborne Gravity 2010 Abstract The
- Page 51 and 52:
Airborne Gravity 2010 That was 2004
- Page 53 and 54:
Airborne Gravity 2010 Geophysics to
- Page 55 and 56:
Airborne Gravity 2010 Operational i
- Page 57 and 58:
Airborne Gravity 2010 were reported
- Page 59 and 60:
Airborne Gravity 2010 � improving
- Page 61 and 62:
Airborne Gravity 2010 Figure 7. Geo
- Page 63 and 64: Airborne Gravity, 2010 Satellite an
- Page 65 and 66: Airborne Gravity, 2010 Modern satel
- Page 67 and 68: Airborne Gravity, 2010 the use of a
- Page 69 and 70: Airborne Gravity, 2010 Table 1. Fit
- Page 71 and 72: Airborne Gravity, 2010 Scheinert et
- Page 73 and 74: Airborne Gravity, 2010 Hwang C, Guo
- Page 75 and 76: Airborne Gravity, 2010 Wolff M (196
- Page 77 and 78: Airborne Gravity 2010 introduces ma
- Page 79 and 80: Airborne Gravity 2010 Images of the
- Page 81 and 82: Airborne Gravity 2010 (a) Figure 4.
- Page 83 and 84: Airborne Gravity 2010 References Ba
- Page 85 and 86: Airborne Gravity 2010 quantitative
- Page 87 and 88: Airborne Gravity 2010 Figure 3. Exc
- Page 89 and 90: Airborne Gravity 2010 The inferred
- Page 91 and 92: Airborne Gravity 2010 Lane, R., and
- Page 93 and 94: Airborne Gravity 2010 New methods,
- Page 95 and 96: Airborne Gravity 2010 Tašárová,
- Page 97 and 98: Airborne Gravity 2010 triangulated
- Page 99 and 100: Airborne Gravity 2010 Inversion for
- Page 101 and 102: Airborne Gravity 2010 Reynisson, R.
- Page 103 and 104: Airborne Gravity 2010 gravity gradi
- Page 105 and 106: Airborne Gravity 2010 There are ver
- Page 107 and 108: Airborne Gravity 2010 Figure 3. Wee
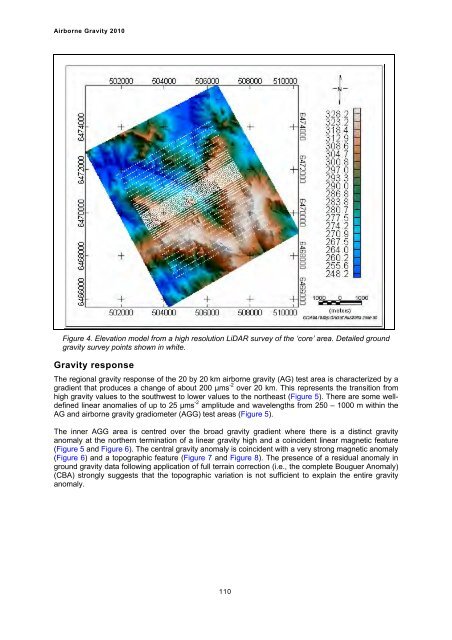
- Page 109 and 110: Airborne Gravity 2010 The ultimate
- Page 111 and 112: Airborne Gravity 2010 Murphy, C.A.,
- Page 113: Airborne Gravity 2010 Figure 2. Reg
- Page 117 and 118: Airborne Gravity 2010 Analysis of t
- Page 119 and 120: Airborne Gravity 2010 Acknowledgmen
- Page 121 and 122: Airborne Gravity 2010 database was
- Page 123 and 124: Airborne Gravity 2010 Gravity surve
- Page 125 and 126: Airborne Gravity 2010 examined for
- Page 127 and 128: Airborne Gravity 2010 Figure 7. Pla
- Page 129 and 130: Airborne Gravity 2010 Barnett, C. T
- Page 131 and 132: Airborne Gravity 2010 forms of dens
- Page 133 and 134: Airborne Gravity 2010 128
- Page 135 and 136: Airborne Gravity 2010 Conclusions W
- Page 137 and 138: Airborne Gravity 2010 interpretatio
- Page 139 and 140: Airborne Gravity 2010 Figure 2. Gra
- Page 141 and 142: Airborne Gravity 2010 Changes in DE
- Page 143 and 144: Airborne Gravity 2010 � � 2 o p
- Page 145 and 146: Airborne Gravity 2010 (a) (b) Figur
- Page 147 and 148: Airborne Gravity 2010 Abstract Rece
- Page 149 and 150: Airborne Gravity 2010 By virtue of
- Page 151 and 152: Airborne Gravity 2010 Table 1. Tabl
- Page 153 and 154: Airborne Gravity 2010 Figure 3. Com
- Page 155 and 156: Airborne Gravity 2010 interpretatio
- Page 157 and 158: Airborne Gravity 2010 GT-1A and GT-
- Page 159 and 160: Airborne Gravity 2010 GT then under
- Page 161 and 162: Airborne Gravity 2010 Figure 4. Spe
- Page 163 and 164: Airborne Gravity 2010 Table 2. The
- Page 165 and 166:
Airborne Gravity 2010 Figure 8. Pos
- Page 167 and 168:
Airborne Gravity 2010 Lines accepte
- Page 169 and 170:
Airborne Gravity 2010 GT-2A develop
- Page 171 and 172:
Airborne Gravity 2010 Figure 14. Th
- Page 173 and 174:
Airborne Gravity 2010 GT-2A develop
- Page 175 and 176:
Airborne Gravity 2010 Future develo
- Page 177 and 178:
Airborne Gravity 2010 Abstract Adva
- Page 179 and 180:
Airborne Gravity 2010 Figure 2. Fir
- Page 181 and 182:
Airborne Gravity 2010 Figure 4. Gra
- Page 183 and 184:
Airborne Gravity 2010 Abstract The
- Page 185 and 186:
Airborne Gravity 2010 Figure 3. Inv
- Page 187 and 188:
Airborne Gravity 2010 Figure 9. Noi
- Page 189 and 190:
Airborne Gravity 2010 regional DEMs
- Page 191 and 192:
Airborne Gravity 2010 (a) (b) Figur
- Page 193 and 194:
Airborne Gravity 2010 Using Solid E
- Page 195 and 196:
Airborne Gravity 2010 The AGG3D inv
- Page 197 and 198:
Airborne Gravity 2010 The lithologi
- Page 199 and 200:
Airborne Gravity 2010 3D imaging of
- Page 201 and 202:
Airborne Gravity 2010 Migration of
- Page 203 and 204:
Airborne Gravity 2010 where is an o
- Page 205 and 206:
Airborne Gravity 2010 wells have be
- Page 207 and 208:
Airborne Gravity 2010 Figure 5. 2D