

Airborne Gravity 2010 - Geoscience Australia
Airborne Gravity 2010 - Geoscience Australia
Airborne Gravity 2010 - Geoscience Australia

Create successful ePaper yourself
Turn your PDF publications into a flip-book with our unique Google optimized e-Paper software.
<strong>Airborne</strong> <strong>Gravity</strong> <strong>2010</strong><br />
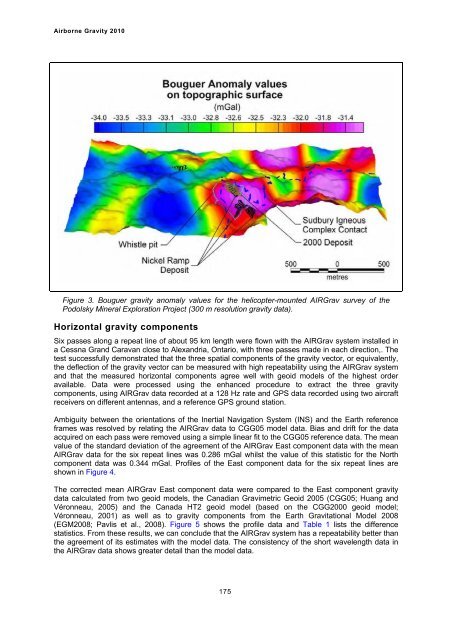
Figure 3. Bouguer gravity anomaly values for the helicopter-mounted AIRGrav survey of the<br />
Podolsky Mineral Exploration Project (300 m resolution gravity data).<br />
Horizontal gravity components<br />
Six passes along a repeat line of about 95 km length were flown with the AIRGrav system installed in<br />
a Cessna Grand Caravan close to Alexandria, Ontario, with three passes made in each direction,. The<br />
test successfully demonstrated that the three spatial components of the gravity vector, or equivalently,<br />
the deflection of the gravity vector can be measured with high repeatability using the AIRGrav system<br />
and that the measured horizontal components agree well with geoid models of the highest order<br />
available. Data were processed using the enhanced procedure to extract the three gravity<br />
components, using AIRGrav data recorded at a 128 Hz rate and GPS data recorded using two aircraft<br />
receivers on different antennas, and a reference GPS ground station.<br />
Ambiguity between the orientations of the Inertial Navigation System (INS) and the Earth reference<br />
frames was resolved by relating the AIRGrav data to CGG05 model data. Bias and drift for the data<br />
acquired on each pass were removed using a simple linear fit to the CGG05 reference data. The mean<br />
value of the standard deviation of the agreement of the AIRGrav East component data with the mean<br />
AIRGrav data for the six repeat lines was 0.286 mGal whilst the value of this statistic for the North<br />
component data was 0.344 mGal. Profiles of the East component data for the six repeat lines are<br />
shown in Figure 4.<br />
The corrected mean AIRGrav East component data were compared to the East component gravity<br />
data calculated from two geoid models, the Canadian Gravimetric Geoid 2005 (CGG05; Huang and<br />
Véronneau, 2005) and the Canada HT2 geoid model (based on the CGG2000 geoid model;<br />
Véronneau, 2001) as well as to gravity components from the Earth Gravitational Model 2008<br />
(EGM2008; Pavlis et al., 2008). Figure 5 shows the profile data and Table 1 lists the difference<br />
statistics. From these results, we can conclude that the AIRGrav system has a repeatability better than<br />
the agreement of its estimates with the model data. The consistency of the short wavelength data in<br />
the AIRGrav data shows greater detail than the model data.<br />
175


