

Airborne Gravity 2010 - Geoscience Australia
Airborne Gravity 2010 - Geoscience Australia
Airborne Gravity 2010 - Geoscience Australia

You also want an ePaper? Increase the reach of your titles
YUMPU automatically turns print PDFs into web optimized ePapers that Google loves.
<strong>Airborne</strong> <strong>Gravity</strong> <strong>2010</strong><br />
Noise analysis and reduction in full tensor gravity<br />
gradiometry data<br />
Introduction<br />
Gary J. Barnes 1 and John M. Lumley 2<br />
1 ARKeX Ltd, Cambridge, U.K. (gary.barnes@arkex.co.uk)<br />
2 ARKeX Ltd, Cambridge, U.K. (john.lumley@arkex.com)<br />
The Full Tensor Gradiometer (FTG) consists of three distinct modules known as gravity gradient<br />
instruments each measuring components of differential curvature. When one sums the three inline<br />
outputs to form a quantity known as the ‘inline sum’, the signals cancel leaving a residual that forms a<br />
useful estimate of the overall FTG performance. This quantity not only forms a useful quality control<br />
measure, but also gives insight into the level and colour (spectral shape) of the gradiometer noise.<br />
When analysing survey data, the make-up of the noise can be partitioned into three categories, 1)<br />
shifts in the mean level, 2) correlated noise and 3) uncorrelated high frequency noise. The<br />
uncorrelated noise is generally what is left over after software corrections that reduce the interference<br />
from the linear and angular motions of the aircraft. Apart from filtering and averaging, little can be done<br />
to reduce this part of the noise. Shifts in the mean level can be seen when viewing data from line to<br />
line where data levels typically shift during the survey turns where different operating conditions exist<br />
and the instrument (being on a stabilised platform) acquires a new attitude in the aircraft. Correlated<br />
noise can be caused by environmental changes such as temperature and pressure and is evident<br />
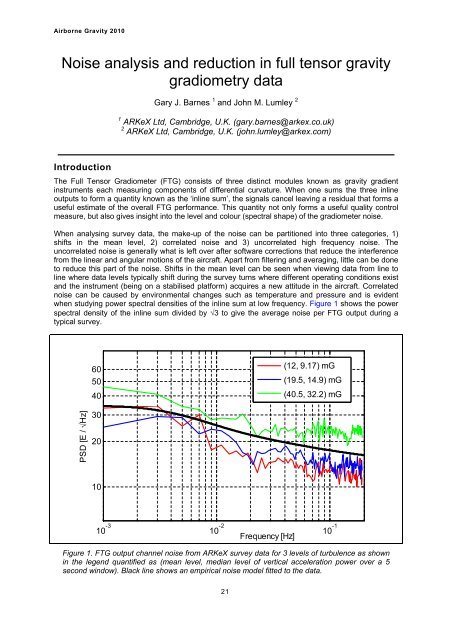
when studying power spectral densities of the inline sum at low frequency. Figure 1 shows the power<br />
spectral density of the inline sum divided by �3 to give the average noise per FTG output during a<br />
typical survey.<br />
PSD [E / �Hz]<br />
60<br />
50<br />
40<br />
30<br />
20<br />
10<br />
10 -3<br />
10 -2<br />
21<br />
Frequency [Hz]<br />
(12, 9.17) mG<br />
(19.5, 14.9) mG<br />
(40.5, 32.2) mG<br />
Figure 1. FTG output channel noise from ARKeX survey data for 3 levels of turbulence as shown<br />
in the legend quantified as (mean level, median level of vertical acceleration power over a 5<br />
second window). Black line shows an empirical noise model fitted to the data.<br />
10 -1


