

Airborne Gravity 2010 - Geoscience Australia
Airborne Gravity 2010 - Geoscience Australia
Airborne Gravity 2010 - Geoscience Australia

You also want an ePaper? Increase the reach of your titles
YUMPU automatically turns print PDFs into web optimized ePapers that Google loves.
<strong>Airborne</strong> <strong>Gravity</strong> <strong>2010</strong><br />
Lines accepted<br />
Five out of 24 passes flown in the Turner Valley tests were not considered in calculating noise levels<br />
because they were short segments. This left us with 19 full-length passes of which we rejected nine<br />
due to high gravity residuals caused by excessive turbulence, although we also rejected two of these<br />
passes due to poor GPS data quality. This left us with a final ten full-length passes which we accepted<br />
for comparison with the AIRGrav system results: 5 out of 5 passes on Line 100; 3 out of 4 passes on<br />
Line 200; and 2 out of 4 passes on Line 400.<br />
Studinger et al. (2007, 2008) include results in various graphs and tables for GT-1A data which fall<br />
well outside the dynamic range limitation of this instrument. For example, Figures 4 (b) and (d) in<br />
Studinger et al. (2008) include data for all GT-1A passes, whereas we found it necessary to reject<br />
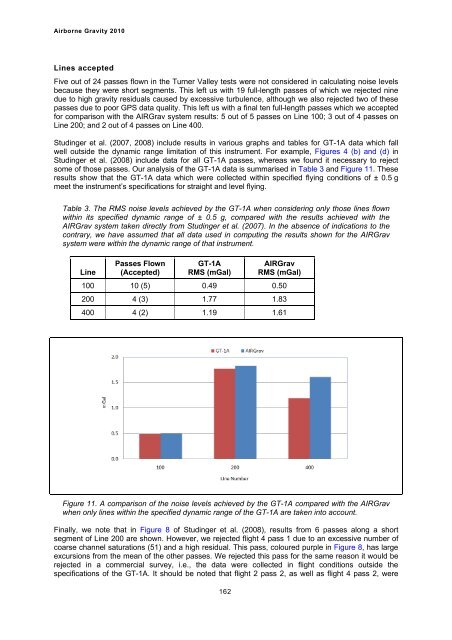
some of those passes. Our analysis of the GT-1A data is summarised in Table 3 and Figure 11. These<br />
results show that the GT-1A data which were collected within specified flying conditions of ± 0.5 g<br />
meet the instrument’s specifications for straight and level flying.<br />
Table 3. The RMS noise levels achieved by the GT-1A when considering only those lines flown<br />
within its specified dynamic range of ± 0.5 g, compared with the results achieved with the<br />
AIRGrav system taken directly from Studinger et al. (2007). In the absence of indications to the<br />
contrary, we have assumed that all data used in computing the results shown for the AIRGrav<br />
system were within the dynamic range of that instrument.<br />
Line<br />
Passes Flown<br />
(Accepted)<br />
GT-1A<br />
RMS (mGal)<br />
162<br />
AIRGrav<br />
RMS (mGal)<br />
100 10 (5) 0.49 0.50<br />
200 4 (3) 1.77 1.83<br />
400 4 (2) 1.19 1.61<br />
Figure 11. A comparison of the noise levels achieved by the GT-1A compared with the AIRGrav<br />
when only lines within the specified dynamic range of the GT-1A are taken into account.<br />
Finally, we note that in Figure 8 of Studinger et al. (2008), results from 6 passes along a short<br />
segment of Line 200 are shown. However, we rejected flight 4 pass 1 due to an excessive number of<br />
coarse channel saturations (51) and a high residual. This pass, coloured purple in Figure 8, has large<br />
excursions from the mean of the other passes. We rejected this pass for the same reason it would be<br />
rejected in a commercial survey, i.e., the data were collected in flight conditions outside the<br />
specifications of the GT-1A. It should be noted that flight 2 pass 2, as well as flight 4 pass 2, were


