

Airborne Gravity 2010 - Geoscience Australia
Airborne Gravity 2010 - Geoscience Australia
Airborne Gravity 2010 - Geoscience Australia

Create successful ePaper yourself
Turn your PDF publications into a flip-book with our unique Google optimized e-Paper software.
<strong>Airborne</strong> <strong>Gravity</strong> <strong>2010</strong><br />
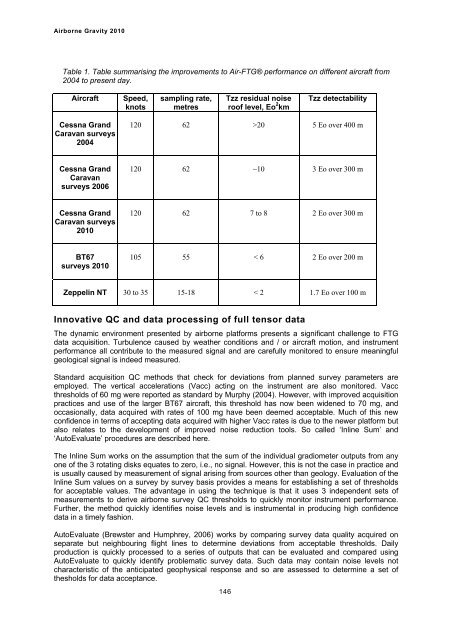
Table 1. Table summarising the improvements to Air-FTG® performance on different aircraft from<br />
2004 to present day.<br />
Aircraft Speed,<br />
knots<br />
Cessna Grand<br />
Caravan surveys<br />
2004<br />
Cessna Grand<br />
Caravan<br />
surveys 2006<br />
Cessna Grand<br />
Caravan surveys<br />
<strong>2010</strong><br />
BT67<br />
surveys <strong>2010</strong><br />
Zeppelin NT<br />
120<br />
120<br />
120<br />
105<br />
30 to 35<br />
sampling rate,<br />
metres<br />
62<br />
62<br />
62<br />
55<br />
15-18<br />
146<br />
Tzz residual noise<br />
roof level, Eo 2 km<br />
>20<br />
~10<br />
7 to 8<br />
Innovative QC and data processing of full tensor data<br />
< 6<br />
< 2<br />
Tzz detectability<br />
5 Eo over 400 m<br />
3 Eo over 300 m<br />
2 Eo over 300 m<br />
2 Eo over 200 m<br />
1.7 Eo over 100 m<br />
The dynamic environment presented by airborne platforms presents a significant challenge to FTG<br />
data acquisition. Turbulence caused by weather conditions and / or aircraft motion, and instrument<br />
performance all contribute to the measured signal and are carefully monitored to ensure meaningful<br />
geological signal is indeed measured.<br />
Standard acquisition QC methods that check for deviations from planned survey parameters are<br />
employed. The vertical accelerations (Vacc) acting on the instrument are also monitored. Vacc<br />
thresholds of 60 mg were reported as standard by Murphy (2004). However, with improved acquisition<br />
practices and use of the larger BT67 aircraft, this threshold has now been widened to 70 mg, and<br />
occasionally, data acquired with rates of 100 mg have been deemed acceptable. Much of this new<br />
confidence in terms of accepting data acquired with higher Vacc rates is due to the newer platform but<br />
also relates to the development of improved noise reduction tools. So called ‘Inline Sum’ and<br />
‘AutoEvaluate’ procedures are described here.<br />
The Inline Sum works on the assumption that the sum of the individual gradiometer outputs from any<br />
one of the 3 rotating disks equates to zero, i.e., no signal. However, this is not the case in practice and<br />
is usually caused by measurement of signal arising from sources other than geology. Evaluation of the<br />
Inline Sum values on a survey by survey basis provides a means for establishing a set of thresholds<br />
for acceptable values. The advantage in using the technique is that it uses 3 independent sets of<br />
measurements to derive airborne survey QC thresholds to quickly monitor instrument performance.<br />
Further, the method quickly identifies noise levels and is instrumental in producing high confidence<br />
data in a timely fashion.<br />
AutoEvaluate (Brewster and Humphrey, 2006) works by comparing survey data quality acquired on<br />
separate but neighbouring flight lines to determine deviations from acceptable thresholds. Daily<br />
production is quickly processed to a series of outputs that can be evaluated and compared using<br />
AutoEvaluate to quickly identify problematic survey data. Such data may contain noise levels not<br />
characteristic of the anticipated geophysical response and so are assessed to determine a set of<br />
thesholds for data acceptance.


