

Airborne Gravity 2010 - Geoscience Australia
Airborne Gravity 2010 - Geoscience Australia
Airborne Gravity 2010 - Geoscience Australia

Create successful ePaper yourself
Turn your PDF publications into a flip-book with our unique Google optimized e-Paper software.
<strong>Airborne</strong> <strong>Gravity</strong> <strong>2010</strong><br />
Analysis of terrain corrections<br />
The terrain corrections calculated by the supplier of the ground gravity survey data were based on<br />
station GPS data and regional SRTM data (Coopes, 2009). As a complement to this work, a brief<br />
investigation of terrain correction parameter settings and input elevation data sets has been carried<br />
out (Grujic, <strong>2010</strong>). The high resolution LiDAR DEM was used for the computation of more accurate<br />
terrain corrections for the ‘core’ AGG area with 1-second SRTM data used to compute the effect of the<br />
more distant terrain. The effects of altering key, user-selectable parameters within the terrain<br />
correction modules of three commercially available software packages were investigated. A suitable<br />
set of parameters including DTM sampling density and data extent were determined, along with the<br />
results of an analysis of the trend of the inaccuracies associated with terrain corrections using a range<br />
of variables.<br />
This work indicated that there was little (mean) difference between the complete Bouguer anomaly<br />
values at ground level corrected using the sparse ground gravity survey GPS elevation data and the<br />
values corrected using the more comprehensively sampled LiDAR elevation data. However, there was<br />
a significant difference between these two sets of corrections when applied to the Gzz gravity<br />
gradiometry response at 80 m height simulated from the same ground gravity data (Figure 8).<br />
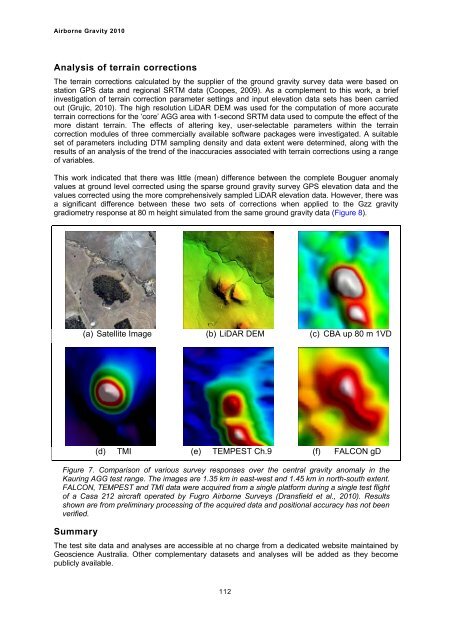
(a) Satellite Image (b) LiDAR DEM (c) CBA up 80 m 1VD<br />
(d) TMI (e) TEMPEST Ch.9 (f) FALCON gD<br />
Figure 7. Comparison of various survey responses over the central gravity anomaly in the<br />
Kauring AGG test range. The images are 1.35 km in east-west and 1.45 km in north-south extent.<br />
FALCON, TEMPEST and TMI data were acquired from a single platform during a single test flight<br />
of a Casa 212 aircraft operated by Fugro <strong>Airborne</strong> Surveys (Dransfield et al., <strong>2010</strong>). Results<br />
shown are from preliminary processing of the acquired data and positional accuracy has not been<br />
verified.<br />
Summary<br />
The test site data and analyses are accessible at no charge from a dedicated website maintained by<br />
<strong>Geoscience</strong> <strong>Australia</strong>. Other complementary datasets and analyses will be added as they become<br />
publicly available.<br />
112


