

Airborne Gravity 2010 - Geoscience Australia
Airborne Gravity 2010 - Geoscience Australia
Airborne Gravity 2010 - Geoscience Australia

You also want an ePaper? Increase the reach of your titles
YUMPU automatically turns print PDFs into web optimized ePapers that Google loves.
<strong>Airborne</strong> <strong>Gravity</strong> <strong>2010</strong><br />
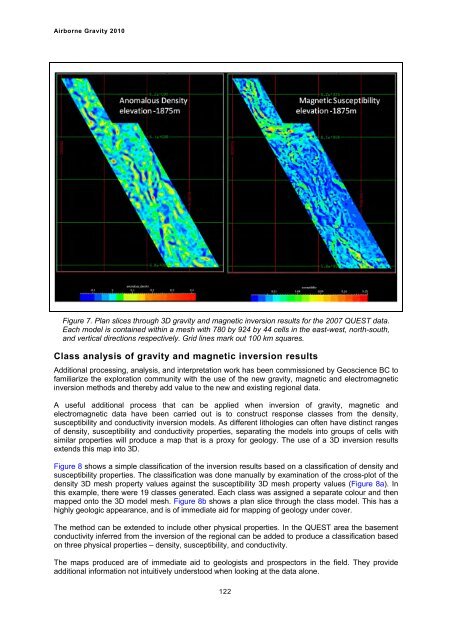
Figure 7. Plan slices through 3D gravity and magnetic inversion results for the 2007 QUEST data.<br />
Each model is contained within a mesh with 780 by 924 by 44 cells in the east-west, north-south,<br />
and vertical directions respectively. Grid lines mark out 100 km squares.<br />
Class analysis of gravity and magnetic inversion results<br />
Additional processing, analysis, and interpretation work has been commissioned by <strong>Geoscience</strong> BC to<br />
familiarize the exploration community with the use of the new gravity, magnetic and electromagnetic<br />
inversion methods and thereby add value to the new and existing regional data.<br />
A useful additional process that can be applied when inversion of gravity, magnetic and<br />
electromagnetic data have been carried out is to construct response classes from the density,<br />
susceptibility and conductivity inversion models. As different lithologies can often have distinct ranges<br />
of density, susceptibility and conductivity properties, separating the models into groups of cells with<br />
similar properties will produce a map that is a proxy for geology. The use of a 3D inversion results<br />
extends this map into 3D.<br />
Figure 8 shows a simple classification of the inversion results based on a classification of density and<br />
susceptibility properties. The classification was done manually by examination of the cross-plot of the<br />
density 3D mesh property values against the susceptibility 3D mesh property values (Figure 8a). In<br />
this example, there were 19 classes generated. Each class was assigned a separate colour and then<br />
mapped onto the 3D model mesh. Figure 8b shows a plan slice through the class model. This has a<br />
highly geologic appearance, and is of immediate aid for mapping of geology under cover.<br />
The method can be extended to include other physical properties. In the QUEST area the basement<br />
conductivity inferred from the inversion of the regional can be added to produce a classification based<br />
on three physical properties – density, susceptibility, and conductivity.<br />
The maps produced are of immediate aid to geologists and prospectors in the field. They provide<br />
additional information not intuitively understood when looking at the data alone.<br />
122


