

Airborne Gravity 2010 - Geoscience Australia
Airborne Gravity 2010 - Geoscience Australia
Airborne Gravity 2010 - Geoscience Australia

Create successful ePaper yourself
Turn your PDF publications into a flip-book with our unique Google optimized e-Paper software.
<strong>Airborne</strong> <strong>Gravity</strong> <strong>2010</strong><br />
Performance of the gravimeter based on results from three different gravimeters on two different<br />
aircraft was improved over specifications by an average of 30%. All new and existing GT-1A and GT-<br />
2A gravimeters have the new shock mount and side panels installed.<br />
(a)<br />
(b)<br />
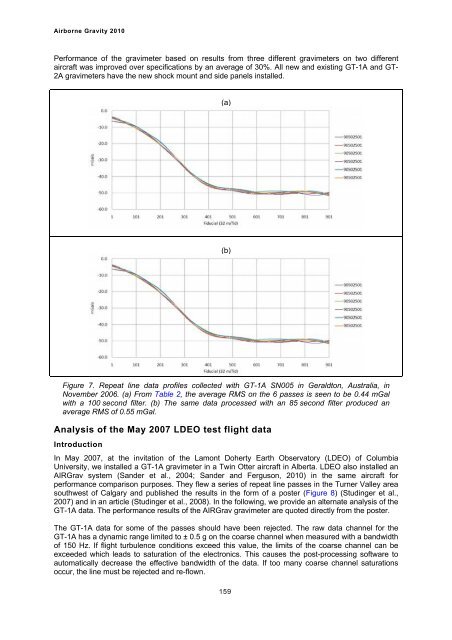
Figure 7. Repeat line data profiles collected with GT-1A SN005 in Geraldton, <strong>Australia</strong>, in<br />
November 2006. (a) From Table 2, the average RMS on the 6 passes is seen to be 0.44 mGal<br />
with a 100 second filter. (b) The same data processed with an 85 second filter produced an<br />
average RMS of 0.55 mGal.<br />
Analysis of the May 2007 LDEO test flight data<br />
Introduction<br />
In May 2007, at the invitation of the Lamont Doherty Earth Observatory (LDEO) of Columbia<br />
University, we installed a GT-1A gravimeter in a Twin Otter aircraft in Alberta. LDEO also installed an<br />
AIRGrav system (Sander et al., 2004; Sander and Ferguson, <strong>2010</strong>) in the same aircraft for<br />
performance comparison purposes. They flew a series of repeat line passes in the Turner Valley area<br />
southwest of Calgary and published the results in the form of a poster (Figure 8) (Studinger et al.,<br />
2007) and in an article (Studinger et al., 2008). In the following, we provide an alternate analysis of the<br />
GT-1A data. The performance results of the AIRGrav gravimeter are quoted directly from the poster.<br />
The GT-1A data for some of the passes should have been rejected. The raw data channel for the<br />
GT-1A has a dynamic range limited to ± 0.5 g on the coarse channel when measured with a bandwidth<br />
of 150 Hz. If flight turbulence conditions exceed this value, the limits of the coarse channel can be<br />
exceeded which leads to saturation of the electronics. This causes the post-processing software to<br />
automatically decrease the effective bandwidth of the data. If too many coarse channel saturations<br />
occur, the line must be rejected and re-flown.<br />
159


