

Airborne Gravity 2010 - Geoscience Australia
Airborne Gravity 2010 - Geoscience Australia
Airborne Gravity 2010 - Geoscience Australia

You also want an ePaper? Increase the reach of your titles
YUMPU automatically turns print PDFs into web optimized ePapers that Google loves.
<strong>Airborne</strong> <strong>Gravity</strong> <strong>2010</strong><br />
Changes in DEM resolution can have a dramatic effect on local features. Changing the resolution from<br />
1 to 30 m for our test example (Figure 4a) introduced a local error of over 400 E, while the RMS error<br />
remained below 1 E. When studying the adequacy of a particular resolution in terrain correction, RMS<br />
differences between maps can be a misleading measure of validity since the power is concentrated<br />
over DC and long-wavelength signals that are largely unaffected.<br />
(a)<br />
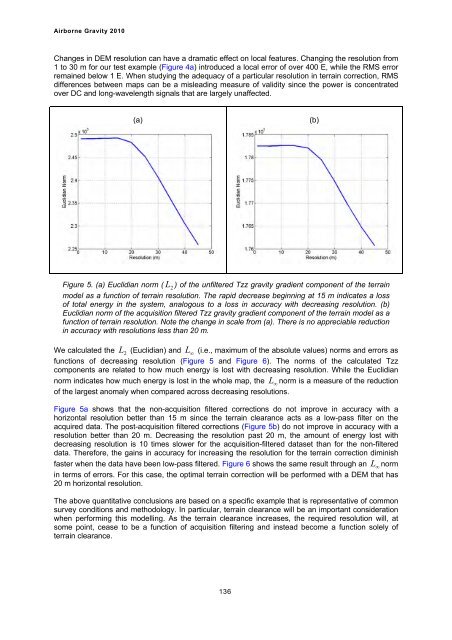
Figure 5. (a) Euclidian norm ( L 2 ) of the unfiltered Tzz gravity gradient component of the terrain<br />
model as a function of terrain resolution. The rapid decrease beginning at 15 m indicates a loss<br />
of total energy in the system, analogous to a loss in accuracy with decreasing resolution. (b)<br />
Euclidian norm of the acquisition filtered Tzz gravity gradient component of the terrain model as a<br />
function of terrain resolution. Note the change in scale from (a). There is no appreciable reduction<br />
in accuracy with resolutions less than 20 m.<br />
We calculated the 2 L (Euclidian) and L � (i.e., maximum of the absolute values) norms and errors as<br />
functions of decreasing resolution (Figure 5 and Figure 6). The norms of the calculated Tzz<br />
components are related to how much energy is lost with decreasing resolution. While the Euclidian<br />
norm indicates how much energy is lost in the whole map, the L� norm is a measure of the reduction<br />
of the largest anomaly when compared across decreasing resolutions.<br />
Figure 5a shows that the non-acquisition filtered corrections do not improve in accuracy with a<br />
horizontal resolution better than 15 m since the terrain clearance acts as a low-pass filter on the<br />
acquired data. The post-acquisition filtered corrections (Figure 5b) do not improve in accuracy with a<br />
resolution better than 20 m. Decreasing the resolution past 20 m, the amount of energy lost with<br />
decreasing resolution is 10 times slower for the acquisition-filtered dataset than for the non-filtered<br />
data. Therefore, the gains in accuracy for increasing the resolution for the terrain correction diminish<br />
faster when the data have been low-pass filtered. Figure 6 shows the same result through an L� norm<br />
in terms of errors. For this case, the optimal terrain correction will be performed with a DEM that has<br />
20 m horizontal resolution.<br />
The above quantitative conclusions are based on a specific example that is representative of common<br />
survey conditions and methodology. In particular, terrain clearance will be an important consideration<br />
when performing this modelling. As the terrain clearance increases, the required resolution will, at<br />
some point, cease to be a function of acquisition filtering and instead become a function solely of<br />
terrain clearance.<br />
136<br />
(b)


