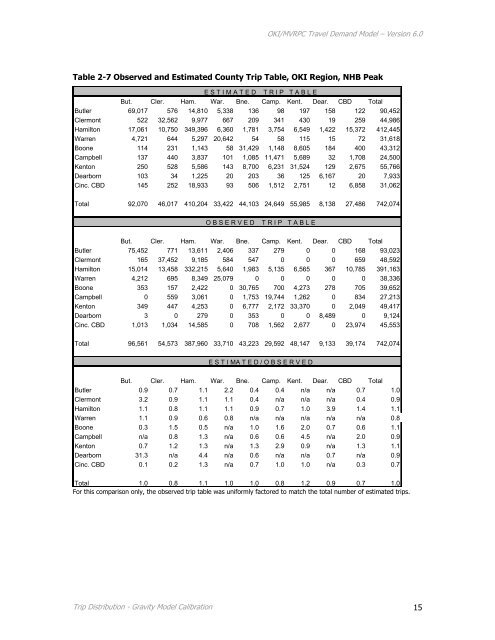
<strong>OKI</strong>/MVRPC <strong>Travel</strong> <strong>Demand</strong> <strong>Model</strong> – Version 6.0Table 2-7 Observed and Estimated County Trip Table, <strong>OKI</strong> Region, NHB PeakE S T I M A T E D T R I P T A B L EBut. Cler. Ham. War. Bne. Camp. Kent. Dear. CBD TotalButler 69,017 576 14,810 5,338 136 98 197 158 122 90,452Clermont 522 32,562 9,977 667 209 341 430 19 259 44,986Hamilton 17,061 10,750 349,396 6,360 1,781 3,754 6,549 1,422 15,372 412,445Warren 4,721 644 5,297 20,642 54 58 115 15 72 31,618Boone 114 231 1,143 58 31,429 1,148 8,605 184 400 43,312Campbell 137 440 3,837 101 1,085 11,471 5,689 32 1,708 24,500Kenton 250 528 5,586 143 8,700 6,231 31,524 129 2,675 55,766Dearborn 103 34 1,225 20 203 36 125 6,167 20 7,933Cinc. CBD 145 252 18,933 93 506 1,512 2,751 12 6,858 31,062Total 92,070 46,017 410,204 33,422 44,103 24,649 55,985 8,138 27,486 742,074O B S E R V E DT R I P T A B L EBut. Cler. Ham. War. Bne. Camp. Kent. Dear. CBD TotalButler 75,452 771 13,611 2,406 337 279 0 0 168 93,023Clermont 165 37,452 9,185 584 547 0 0 0 659 48,592Hamilton 15,014 13,458 332,215 5,640 1,983 5,135 6,565 367 10,785 391,163Warren 4,212 695 8,349 25,079 0 0 0 0 0 38,336Boone 353 157 2,422 0 30,765 700 4,273 278 705 39,652Campbell 0 559 3,061 0 1,753 19,744 1,262 0 834 27,213Kenton 349 447 4,253 0 6,777 2,172 33,370 0 2,049 49,417Dearborn 3 0 279 0 353 0 0 8,489 0 9,124Cinc. CBD 1,013 1,034 14,585 0 708 1,562 2,677 0 23,974 45,553Total 96,561 54,573 387,960 33,710 43,223 29,592 48,147 9,133 39,174 742,074E S T I MA T E D / O B S E R V E DBut. Cler. Ham. War. Bne. Camp. Kent. Dear. CBD TotalButler 0.9 0.7 1.1 2.2 0.4 0.4 n/a n/a 0.7 1.0Clermont 3.2 0.9 1.1 1.1 0.4 n/a n/a n/a 0.4 0.9Hamilton 1.1 0.8 1.1 1.1 0.9 0.7 1.0 3.9 1.4 1.1Warren 1.1 0.9 0.6 0.8 n/a n/a n/a n/a n/a 0.8Boone 0.3 1.5 0.5 n/a 1.0 1.6 2.0 0.7 0.6 1.1Campbell n/a 0.8 1.3 n/a 0.6 0.6 4.5 n/a 2.0 0.9Kenton 0.7 1.2 1.3 n/a 1.3 2.9 0.9 n/a 1.3 1.1Dearborn 31.3 n/a 4.4 n/a 0.6 n/a n/a 0.7 n/a 0.9Cinc. CBD 0.1 0.2 1.3 n/a 0.7 1.0 1.0 n/a 0.3 0.7Total 1.0 0.8 1.1 1.0 1.0 0.8 1.2 0.9 0.7 1.0For this comparison only, the observed trip table was uniformly factored to match the total number of estimated trips.Trip Distribution - Gravity <strong>Model</strong> Calibration 15
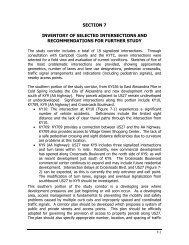
<strong>OKI</strong>/MVRPC <strong>Travel</strong> <strong>Demand</strong> <strong>Model</strong> – Version 6.0Table 2-8 Observed and Estimated County Trip Table, <strong>OKI</strong> Region, NHB Off PeakE S T I M A T E D T R I P T A B L EBut. Cler. Ham. War. Bne. Camp. Kent. Dear. CBD TotalButler 77,177 635 19,094 5,129 72 117 193 86 142 102,645Clermont 681 40,733 10,512 850 154 406 348 6 183 53,873Hamilton 20,418 11,759 409,687 7,491 1,406 2,628 4,369 1,383 12,672 471,813Warren 4,881 768 6,773 24,340 29 48 84 6 62 36,991Boone 61 150 1,034 28 37,190 1,278 8,714 199 367 49,021Campbell 131 432 2,813 76 1,297 17,475 5,840 21 1,182 29,267Kenton 217 398 3,662 88 9,124 6,301 43,056 102 1,586 64,534Dearborn 72 3 1,141 4 219 21 100 7,394 11 8,965Cinc. CBD 172 245 15,564 84 487 1,232 2,166 12 8,366 28,328Total 103,810 55,123 470,280 38,090 49,978 29,506 64,870 9,209 24,571 845,437O B S E R V E DT R I P T A B L EBut. Cler. Ham. War. Bne. Camp. Kent. Dear. CBD TotalButler 91,118 529 13,904 5,475 0 262 275 2 440 112,006Clermont 760 43,612 11,479 243 279 0 491 295 514 57,674Hamilton 12,803 14,673 382,320 3,017 2,487 3,998 4,610 1,088 10,890 435,886Warren 3,823 1,121 4,294 29,987 124 0 262 0 0 39,612Boone 0 642 1,909 0 37,155 1,593 6,759 276 836 49,170Campbell 552 66 2,786 244 659 23,279 3,340 0 219 31,145Kenton 262 1,047 5,336 0 5,146 3,311 48,025 0 820 63,946Dearborn 0 0 182 0 0 0 0 9,314 0 9,496Cinc. CBD 276 198 13,999 131 770 988 1,806 0 28,334 46,501Total 109,595 61,888 436,208 39,098 46,619 33,431 65,568 10,975 42,054 845,437E S T I MA T E D / O B S E R V E DBut. Cler. Ham. War. Bne. Camp. Kent. Dear. CBD TotalButler 0.8 1.2 1.4 0.9 n/a 0.4 0.7 50.0 0.3 0.9Clermont 0.9 0.9 0.9 3.5 0.6 n/a 0.7 0.0 0.4 0.9Hamilton 1.6 0.8 1.1 2.5 0.6 0.7 0.9 1.3 1.2 1.1Warren 1.3 0.7 1.6 0.8 0.2 n/a 0.3 n/a n/a 0.9Boone n/a 0.2 0.5 n/a 1.0 0.8 1.3 0.7 0.4 1.0Campbell 0.2 6.5 1.0 0.3 2.0 0.8 1.7 n/a 5.4 0.9Kenton 0.8 0.4 0.7 n/a 1.8 1.9 0.9 n/a 1.9 1.0Dearborn n/a n/a 6.3 n/a n/a n/a n/a 0.8 n/a 0.9Cinc. CBD 0.6 1.2 1.1 0.6 0.6 1.2 1.2 n/a 0.3 0.6Total 0.9 0.9 1.1 1.0 1.1 0.9 1.0 0.8 0.6 1.0For this comparison only, the observed trip table was uniformly factored to match the total number of estimated trips.Trip Distribution - Gravity <strong>Model</strong> Calibration 16
- Page 1 and 2:
APPENDIX F • TRAVEL DEMAND MODEL
- Page 3 and 4:
OKI/MVRPCTravel Demand ModelVersion
- Page 5 and 6:
Table of ContentsPart IPart IIPart
- Page 7 and 8:
OKI/MVRPC Travel Demand Model - Ver
- Page 9 and 10:
OKI/MVRPC Travel Demand Model - Ver
- Page 11 and 12:
OKI/MVRPC Travel Demand Model - Ver
- Page 13 and 14:
OKI/MVRPC Travel Demand Model - Ver
- Page 15 and 16:
OKI/MVRPC Travel Demand Model - Ver
- Page 17 and 18:
OKI/MVRPC Travel Demand Model - Ver
- Page 19 and 20:
OKI/MVRPC Travel Demand Model - Ver
- Page 21 and 22:
OKI/MVRPC Travel Demand Model - Ver
- Page 23 and 24:
OKI/MVRPC Travel Demand Model - Ver
- Page 25 and 26:
OKI/MVRPC Travel Demand Model - Ver
- Page 27 and 28:
OKI/MVRPC Travel Demand Model - Ver
- Page 29 and 30:
OKI/MVRPC Travel Demand Model - Ver
- Page 31 and 32:
OKI/MVRPC Travel Demand Model - Ver
- Page 33 and 34:
OKI/MVRPC Travel Demand Model - Ver
- Page 35 and 36:
OKI/MVRPC Travel Demand Model - Ver
- Page 37 and 38:
Table A.1 (cont.)Zone System Equiva
- Page 39 and 40:
Table A.1 (cont.)Zone System Equiva
- Page 41 and 42:
Table A.1 (cont.)Zone System Equiva
- Page 43 and 44:
Table A.1 (cont.)Zone System Equiva
- Page 45 and 46:
Table A.1 (cont.)Zone System Equiva
- Page 47 and 48:
Table A.2Zone System Equivalences -
- Page 49 and 50:
Table A.2 (cont.)Zone System Equiva
- Page 51 and 52:
Table A.2 (cont.)Zone System Equiva
- Page 53 and 54:
Table A.3Zone System Equivalences -
- Page 55 and 56:
Table B.1External Stations in the C
- Page 57 and 58:
Table B.1External Stations in the C
- Page 59 and 60:
OKI/MVRPC Travel Demand Model - Ver
- Page 61 and 62:
OKI/MVRPC Travel Demand Model - Ver
- Page 63 and 64:
OKI/MVRPC Travel Demand Model - Ver
- Page 65 and 66:
OKI/MVRPC Travel Demand Model - Ver
- Page 67 and 68:
OKI/MVRPC Travel Demand Model - Ver
- Page 69 and 70:
OKI/MVRPC Travel Demand Model - Ver
- Page 71 and 72:
OKI/MVRPC Travel Demand Model - Ver
- Page 73 and 74:
OKI/MVRPC Travel Demand Model - Ver
- Page 75 and 76:
OKI/MVRPC Travel Demand Model - Ver
- Page 77 and 78:
OKI/MVRPC Travel Demand Model - Ver
- Page 79 and 80:
OKI/MVRPC Travel Demand Model - Ver
- Page 81 and 82:
OKI/MVRPC Travel Demand Model - Ver
- Page 83 and 84:
OKI/MVRPC Travel Demand Model - Ver
- Page 85 and 86:
OKI/MVRPC Travel Demand Model - Ver
- Page 87 and 88:
OKI/MVRPC Travel Demand Model - Ver
- Page 89 and 90:
OKI/MVRPC Travel Demand Model - Ver
- Page 91 and 92:
OKI/MVRPC Travel Demand Model - Ver
- Page 93 and 94:
OKI/MVRPC Travel Demand Model - Ver
- Page 95 and 96:
OKI/MVRPC Travel Demand Model - Ver
- Page 97 and 98:
OKI/MVRPC Travel Demand Model - Ver
- Page 99 and 100:
OKI/MVRPC Travel Demand Model - Ver
- Page 101 and 102:
OKI/MVRPC Travel Demand Model - Ver
- Page 103 and 104:
User Documentation forAutomated Acc
- Page 105 and 106:
[Transit Format][New Link Attribute
- Page 107 and 108:
distance for each centroid or node.
- Page 109 and 110:
Figure 1Example Control File for th
- Page 111 and 112:
LinkType = 99VolumeDelay = 99Lanes
- Page 113 and 114:
NetworkScale = 1.0 Scale factor to
- Page 115 and 116:
Figure 4Example Output from DRVLINK
- Page 117 and 118:
Appendix ASample EMME/2 Transit Lin
- Page 119 and 120:
Appendix FTravel Demand ModelingTec
- Page 121 and 122:
Index of TablesTable 2-1 Socio-Econ
- Page 123 and 124:
OKI/MVRPC Travel Demand Model - Ver
- Page 125 and 126:
OKI/MVRPC Travel Demand Model - Ver
- Page 127 and 128:
OKI/MVRPC Travel Demand Model - Ver
- Page 129 and 130:
OKI/MVRPC Travel Demand Model - Ver
- Page 131 and 132:
OKI/MVRPC Travel Demand Model - Ver
- Page 133 and 134:
OKI/MVRPC Travel Demand Model - Ver
- Page 135 and 136:
OKI/MVRPC Travel Demand Model - Ver
- Page 137 and 138:
OKI/MVRPC Travel Demand Model - Ver
- Page 139 and 140:
OKI/MVRPC Travel Demand Model - Ver
- Page 141 and 142:
OKI/MVRPC Travel Demand Model - Ver
- Page 143 and 144:
OKI/MVRPC Travel Demand Model - Ver
- Page 145 and 146:
OKI/MVRPC Travel Demand Model - Ver
- Page 147 and 148:
OKI/MVRPC Travel Demand Model - Ver
- Page 149 and 150:
OKI/MVRPC Travel Demand Model - Ver
- Page 151 and 152:
OKI/MVRPC Travel Demand Model - Ver
- Page 153 and 154: OKI/MVRPC Travel Demand Model - Ver
- Page 155 and 156: OKI/MVRPC Travel Demand Model - Ver
- Page 157 and 158: OKI/MVRPC Travel Demand Model - Ver
- Page 159 and 160: OKI/MVRPC Travel Demand Model - Ver
- Page 161 and 162: OKI/MVRPC Travel Demand Model - Ver
- Page 163 and 164: OKI/MVRPC Travel Demand Model - Ver
- Page 165 and 166: OKI/MVRPC Travel Demand Model - Ver
- Page 167 and 168: OKI/MVRPC Travel Demand Model - Ver
- Page 169 and 170: OKI/MVRPC Travel Demand Model - Ver
- Page 171 and 172: OKI/MVRPC Travel Demand Model - Ver
- Page 173 and 174: OKI/MVRPC Travel Demand Model - Ver
- Page 175 and 176: OKI/MVRPC Travel Demand Model - Ver
- Page 177 and 178: OKI/MVRPC Travel Demand Model - Ver
- Page 179 and 180: OKI/MVRPC Travel Demand Model - Ver
- Page 181 and 182: OKI/MVRPC Travel Demand Model - Ver
- Page 183 and 184: OKI/MVRPC Travel Demand Model - Ver
- Page 185 and 186: OKI/MVRPC Travel Demand Model - Ver
- Page 187 and 188: Appendix FTravel Demand ModelingTec
- Page 189 and 190: Index of TablesTable 2-1 Trip Lengt
- Page 191 and 192: OKI/MVRPC Travel Demand Model - Ver
- Page 193 and 194: OKI/MVRPC Travel Demand Model - Ver
- Page 195 and 196: OKI/MVRPC Travel Demand Model - Ver
- Page 197 and 198: OKI/MVRPC Travel Demand Model - Ver
- Page 199 and 200: OKI/MVRPC Travel Demand Model - Ver
- Page 201 and 202: OKI/MVRPC Travel Demand Model - Ver
- Page 203: OKI/MVRPC Travel Demand Model - Ver
- Page 207 and 208: OKI/MVRPC Travel Demand Model - Ver
- Page 209 and 210: OKI/MVRPC Travel Demand Model - Ver
- Page 211 and 212: OKI/MVRPC Travel Demand Model - Ver
- Page 213 and 214: OKI/MVRPC Travel Demand Model - Ver
- Page 215 and 216: OKI/MVRPC Travel Demand Model - Ver
- Page 217 and 218: OKI/MVRPC Travel Demand Model - Ver
- Page 219 and 220: OKI/MVRPC Travel Demand Model - Ver
- Page 221 and 222: OKI/MVRPC Travel Demand Model - Ver
- Page 223 and 224: OKI/MVRPC Travel Demand Model - Ver
- Page 225 and 226: OKI/MVRPC Travel Demand Model - Ver
- Page 227 and 228: Table of Contents1. Background ....
- Page 229 and 230: Index of FiguresFigure 2-1 Alternat
- Page 231 and 232: OKI/MVRPC Travel Demand Model - Ver
- Page 233 and 234: OKI/MVRPC Travel Demand Model - Ver
- Page 235 and 236: OKI/MVRPC Travel Demand Model - Ver
- Page 237 and 238: OKI/MVRPC Travel Demand Model - Ver
- Page 239 and 240: OKI/MVRPC Travel Demand Model - Ver
- Page 241 and 242: OKI/MVRPC Travel Demand Model - Ver
- Page 243 and 244: OKI/MVRPC Travel Demand Model - Ver
- Page 245 and 246: OKI/MVRPC Travel Demand Model - Ver
- Page 247 and 248: OKI/MVRPC Travel Demand Model - Ver
- Page 249 and 250: OKI/MVRPC Travel Demand Model - Ver
- Page 251 and 252: OKI/MVRPC Travel Demand Model - Ver
- Page 253 and 254: OKI/MVRPC Travel Demand Model - Ver
- Page 255 and 256:
OKI/MVRPC Travel Demand Model - Ver
- Page 257 and 258:
OKI/MVRPC Travel Demand Model - Ver
- Page 259 and 260:
OKI/MVRPC Travel Demand Model - Ver
- Page 261 and 262:
OKI/MVRPC Travel Demand Model - Ver
- Page 263 and 264:
OKI/MVRPC Travel Demand Model - Ver
- Page 265 and 266:
OKI/MVRPC Travel Demand Model - Ver
- Page 267 and 268:
OKI/MVRPC Travel Demand Model - Ver
- Page 269 and 270:
OKI/MVRPC Travel Demand Model - Ver
- Page 271 and 272:
NORTH-SOUTH TRANSPORTATION INITIATI
- Page 273 and 274:
NORTH-SOUTH TRANSPORTATION INITIATI
- Page 275 and 276:
NORTH-SOUTH TRANSPORTATION INITIATI
- Page 277 and 278:
NORTH-SOUTH TRANSPORTATION INITIATI
- Page 279 and 280:
NORTH-SOUTH TRANSPORTATION INITIATI
- Page 281 and 282:
Run # 63: Start with 7.17 estimatio
- Page 283 and 284:
Run # 67:Split parking cost from ot
- Page 285 and 286:
Run # 70a:Include zero-auto segment
- Page 287 and 288:
Run # 71c:Repeat #71a with zero aut
- Page 289 and 290:
Run # 71g:Repeat #71d with wait tim
- Page 291 and 292:
Run # 73:Include residential densit
- Page 293 and 294:
Run # 76:Nest: auto vs transitVaria
- Page 295 and 296:
Run # 79:Repeat #72 with zero autos
- Page 297 and 298:
Run # 80:Nest: auto vs. all othersV
- Page 299 and 300:
Run # 82:(071h) nested: auto vs tra
- Page 301 and 302:
Run #3VariableModeDrive Shared Ride
- Page 303 and 304:
Run #8VariableModeDrive Shared Ride
- Page 305 and 306:
Run #12 test: make aoc=10.5 instead
- Page 307 and 308:
Run #29VariableModeDrive Shared Rid
- Page 309 and 310:
Run #33VariableModeDrive Shared Rid
- Page 311 and 312:
Run #37vot constrained to $7.00Vari
- Page 313 and 314:
Run #30bSame as #30a, combine cost
- Page 315 and 316:
Run #140 (same as run #40)vot const
- Page 317 and 318:
Run #140b (same as run #40)vot cons
- Page 319 and 320:
Run #141avot constrained to $3.00 &
- Page 321 and 322:
Run #141cvot constrained to $3.00 &
- Page 323 and 324:
Run # 1:Base RunVariablesModesDA Sh
- Page 325 and 326:
Run # 5:Base Run with walk time set
- Page 327 and 328:
Run # 8:Base Run, split walkVariabl
- Page 329 and 330:
Run # 10: Nested structure (autos v
- Page 331 and 332:
Part VITRIP ASSIGNMENT ANDVALIDATIO
- Page 333 and 334:
Index of TablesTable 2-1 Average Ve
- Page 335 and 336:
OKI/MVRPC Travel Demand Model - Ver
- Page 337 and 338:
OKI/MVRPC Travel Demand Model - Ver
- Page 339 and 340:
OKI/MVRPC Travel Demand Model - Ver
- Page 341 and 342:
OKI/MVRPC Travel Demand Model - Ver
- Page 343 and 344:
OKI/MVRPC Travel Demand Model - Ver
- Page 345 and 346:
OKI/MVRPC Travel Demand Model - Ver
- Page 347 and 348:
OKI/MVRPC Travel Demand Model - Ver
- Page 349 and 350:
OKI/MVRPC Travel Demand Model - Ver
- Page 351 and 352:
OKI/MVRPC Travel Demand Model - Ver
- Page 353 and 354:
OKI/MVRPC Travel Demand Model - Ver
- Page 355 and 356:
VOBFigure 4-8 Screenline Location -
- Page 357 and 358:
2759OKI/MVRPC Travel Demand Model -
- Page 359 and 360:
OKI/MVRPC Travel Demand Model - Ver
- Page 361 and 362:
OKI/MVRPC Travel Demand Model - Ver
- Page 363 and 364:
OKI/MVRPC Travel Demand Model - Ver
- Page 365 and 366:
OKI/MVRPC Travel Demand Model - Ver
- Page 367 and 368:
OKI/MVRPC Travel Demand Model - Ver
- Page 369 and 370:
OKI/MVRPC Travel Demand Model - Ver
- Page 371 and 372:
OKI/MVRPC Travel Demand Model - Ver
- Page 373 and 374:
OKI/MVRPC Travel Demand Model - Ver
- Page 375 and 376:
OKI/MVRPC Travel Demand Model - Ver
- Page 377 and 378:
OKI/MVRPC Travel Demand Model - Ver
- Page 379 and 380:
OKI/MVRPC Travel Demand Model - Ver
- Page 381 and 382:
OKI/MVRPC Travel Demand Model - Ver
- Page 383 and 384:
OKI/MVRPC Travel Demand Model - Ver
- Page 385 and 386:
OKI/MVRPC Travel Demand Model - Ver
- Page 387 and 388:
OKI/MVRPC Travel Demand Model - Ver
- Page 389 and 390:
OKI/MVRPC Travel Demand Model - Ver
- Page 391 and 392:
Table of Contents1. Introduction...
- Page 393 and 394:
OKI/MVRPC Travel Demand Model - Ver
- Page 395 and 396:
OKI/MVRPC Travel Demand Model - Ver
- Page 397 and 398:
OKI/MVRPC Travel Demand Model - Ver
- Page 399 and 400:
OKI/MVRPC Travel Demand Model - Ver
- Page 401 and 402:
OKI/MVRPC Travel Demand Model - Ver
- Page 403 and 404:
OKI/MVRPC Travel Demand Model - Ver
- Page 405 and 406:
OKI/MVRPC Travel Demand Model - Ver
- Page 407 and 408:
OKI/MVRPC Travel Demand Model - Ver
- Page 409 and 410:
OKI/MVRPC Travel Demand Model - Ver
- Page 411 and 412:
OKI/MVRPC Travel Demand Model - Ver
- Page 413 and 414:
OKI/MVRPC Travel Demand Model - Ver
- Page 415 and 416:
OKI/MVRPC Travel Demand Model - Ver
- Page 417 and 418:
OKI/MVRPC Travel Demand Model - Ver
- Page 419 and 420:
OKI/MVRPC Travel Demand Model - Ver
- Page 421 and 422:
OKI/MVRPC Travel Demand Model - Ver
- Page 423 and 424:
OKI/MVRPC Travel Demand Model - Ver
- Page 425 and 426:
OKI/MVRPC Travel Demand Model - Ver
- Page 427 and 428:
OKI/MVRPC Travel Demand Model - Ver
- Page 429 and 430:
OKI/MVRPC Travel Demand Model - Ver
- Page 431 and 432:
OKI/MVRPC Travel Demand Model - Ver
- Page 433 and 434:
OKI/MVRPC Travel Demand Model - Ver
- Page 435 and 436:
OKI/MVRPC Travel Demand Model - Ver
- Page 437 and 438:
OKI/MVRPC Travel Demand Model - Ver
- Page 439 and 440:
OKI/MVRPC Travel Demand Model - Ver
- Page 441 and 442:
OKI/MVRPC Travel Demand Model - Ver
- Page 443 and 444:
OKI/MVRPC Travel Demand Model - Ver
- Page 445 and 446:
OKI/MVRPC Travel Demand Model - Ver
- Page 447 and 448:
Appendix FTravel Demand ModelingTec
- Page 449 and 450:
Table of Contents1. Introduction...
- Page 451 and 452:
2. Surveys and Other Datasets2.1 OK
- Page 453 and 454:
Table 2-1 OKI Home Interview Survey
- Page 455 and 456:
Table 2-1 OKI Home Interview Survey
- Page 457 and 458:
Table 2-1 OKI Home Interview Survey
- Page 459 and 460:
Table 1-4 On-Board Survey Data Dict
- Page 461 and 462:
2.3 External Station Survey - Conso
- Page 463 and 464:
2.4 External Cordon Survey - Consol
- Page 465 and 466:
2.5 External-External Trip Table fr
- Page 467 and 468:
2.20 Screenline Shape File - Screen