Untitled - HKU Libraries - The University of Hong Kong
Untitled - HKU Libraries - The University of Hong Kong
Untitled - HKU Libraries - The University of Hong Kong
- No tags were found...

Create successful ePaper yourself
Turn your PDF publications into a flip-book with our unique Google optimized e-Paper software.
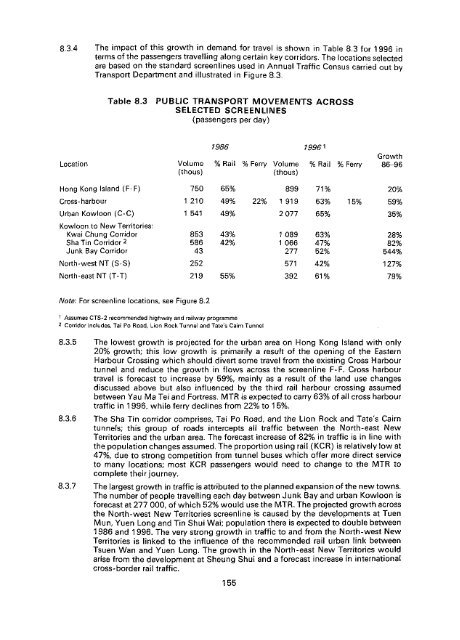
8.3.4 <strong>The</strong> impact <strong>of</strong> this growth in demand for travel is shown in Table 8.3 for 1996 interms <strong>of</strong> the passengers travelling along certain key corridors. <strong>The</strong> locations selectedare based on the standard screenlines used in Annual Traffic Census carried out byTransport Department and illustrated in Figure 8.3.8.3(passengers per day)Location1986 1996^Volume % Rail % Ferry Volume % Rail(thous)(thous)% FerryGrowth86-96<strong>Hong</strong> <strong>Kong</strong> Island (F-F)Cross-harbourUrban Kowioon (C-C)7501 2101 54165%49%49%22%8991 919207771%63%65%15%20%59%35%Kowloon to New Territories:Kwas Chung CorridorSha Tin Corridor 2Junk Bay Corridor8535864343%42%1 0891 06627763%47%52%28%82%544%North-west NT (S-S)25257142%127%North-east'NT (T-T)21955%39261%79%Note: For screenline locations, see Figure 8.21 Assumes CTS-2 recommended highway and railway programme2 Corridor includes, Tai Po Road, Lion Rock Tunnel and Tate's Cairn Tunnel8.3.5 <strong>The</strong> lowest growth is projected for the urban area on <strong>Hong</strong> <strong>Kong</strong> Island with only20% growth; this low growth is primarily a result <strong>of</strong> the opening <strong>of</strong> the EasternHarbour Crossing which should divert some travel from the existing Cross Harbourtunnel and reduce the growth in flows across the screenline F-F. Cross harbourtravel is forecast to increase by 59%, mainly as a result <strong>of</strong> the land use changesdiscussed above but also influenced by the third rail harbour crossing assumedbetween Yau Ma Tes and Fortress. MTR is expected to carry 63% <strong>of</strong> all cross harbourtraffic in 1996, while ferry declines from 22% to 1 5%.8.3.6 <strong>The</strong> Sha Tin corridor comprises, Tai Po Road, and the Lion Rock and Tate's Cairntunnels; this group <strong>of</strong> roads intercepts all traffic between the North-east NewTerritories and the urban area. <strong>The</strong> forecast increase <strong>of</strong> 82% in traffic is in line withthe population changes assumed. <strong>The</strong> proportion using rail (KCR) is relatively low at47%, due to strong competition from tunnel buses which <strong>of</strong>fer more direct serviceto many locations; most KCR passengers would need to change to the MTR tocomplete their journey.8.3.7 <strong>The</strong> largest growth in traffic is attributed to the planned expansion <strong>of</strong> the new towns.<strong>The</strong> number <strong>of</strong> people travelling each day between Junk Bay and urban Kowloon isforecast at 277 000, <strong>of</strong> which 52% would use the MTR. <strong>The</strong> projected growth acrossthe North-west New Territories screenline is caused by the developments at TuenMun, Yuen Long and Tin Shui Was; population there is expected to double between1986 and 1996. <strong>The</strong> very strong growth in traffic to and from the North-west NewTerritories is linked to the influence <strong>of</strong> the recommended rail urban link betweenTsuen Wan and Yuen Long. <strong>The</strong> growth in the North-east New Territories wouldarise from the development at Sheung Shui and a forecast increase in internationalcross-border rail traffic.155