Untitled - HKU Libraries - The University of Hong Kong
Untitled - HKU Libraries - The University of Hong Kong
Untitled - HKU Libraries - The University of Hong Kong
- No tags were found...

Create successful ePaper yourself
Turn your PDF publications into a flip-book with our unique Google optimized e-Paper software.
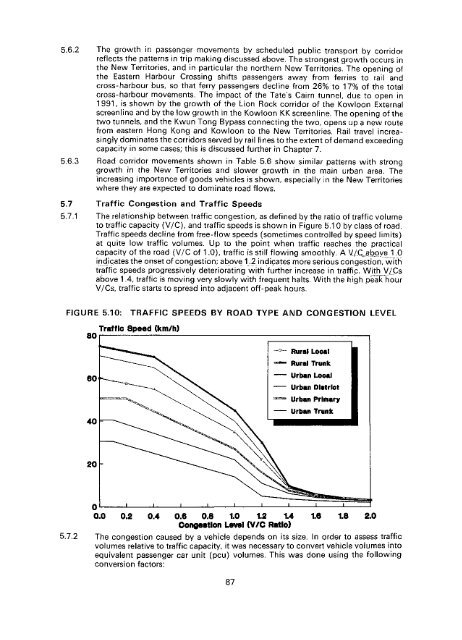
5.6.2 <strong>The</strong> growth in passenger movements by scheduled public transport by corridorreflects the patterns in trip making discussed above. <strong>The</strong> strongest growth occurs inthe New Territories, and in particular the northern New Territories, <strong>The</strong> opening <strong>of</strong>the Eastern Harbour Crossing shifts passengers away from ferries to rail andcross-harbour bus, so that ferry passengers decline from 26% to 17% <strong>of</strong> the totalcross-harbour movements. <strong>The</strong> impact <strong>of</strong> the Tate's Cairn tunnel, due to open in1991, is shown by the growth <strong>of</strong> the Lion Rock corridor <strong>of</strong> the Kowloon Externalscreenline and by the low growth in the Kowloon KK screenline. <strong>The</strong> opening <strong>of</strong> thetwo tunnels, and the Kwun Tong Bypass connecting the two, opens up a new routefrom eastern <strong>Hong</strong> <strong>Kong</strong> and Kowloon to the New Territories. Rail travel increasinglydominates the corridors served by rail lines to the extent <strong>of</strong> demand exceedingcapacity in some cases; this is discussed further in Chapter 7.5.6.3 Road corridor movements shown in Table 5.6 show similar patterns with stronggrowth in the New Territories and slower growth in the main urban area. <strong>The</strong>increasing importance <strong>of</strong> goods vehicles is shown, especially in the New Territorieswhere they are expected to dominate road flows.5.7 Traffic Congestion and Traffic Speeds5.7.1 <strong>The</strong> relationship between traffic congestion, as defined by the ratio <strong>of</strong> traffic volumeto traffic capacity (V/C), and traffic speeds is shown in Figure 5.1 0 by class <strong>of</strong> road.Traffic speeds decline from free-flow speeds (sometimes controlled by speed limits)at quite low traffic volumes. Up to the point when traffic reaches the practicalcapacity <strong>of</strong> the road (V/C <strong>of</strong> 1.0), traffic is still flowing smoothly. A V/C^bpye 1.0indicates the onset <strong>of</strong> congestion; above,1.2 indicates more serious congestion, withtraffic speeds progressively deteriorating with further increase in traffic. With V/Csabove 1,4, traffic is moving very slowly with frequent halts. With the high peak hourV/Cs, traffic starts to spread into adjacent <strong>of</strong>f-peak hours.5.10: TRAFFIC BY TYPE LEVEL0.8 0.8 1.0 1.2 145.7.2<strong>The</strong> congestion caused by a vehicle depends on its size. In order to assess trafficvolumes relative to traffic capacity, it was necessary to convert vehicle volumes intoequivalent passenger car unit (pcu) volumes. This was done using the followingconversion factors:87