- Page 2 and 3:
THE UNIVERSITY OF HONG KONGLIBRARIE
- Page 4 and 5:
EPPrinted and Published by the Gove
- Page 6 and 7:
CONTENTSPage6. OF 966.1 Introductio
- Page 8 and 9:
Page3.1 Licensed Vehicles 1976-1988
- Page 10 and 11:
FIGURES_Page1.1 Special Character o
- Page 12 and 13:
Page1.1 Second Comprehensive Transp
- Page 14 and 15:
TRANSPORTPER UNIT OF GDPCars Per Th
- Page 16 and 17:
KCR Double Tracking &\ Electrificat
- Page 18 and 19:
1.2 The Second Comprehensive Transp
- Page 20 and 21: 1.2.17 The way in which these recla
- Page 22 and 23: ANNEX1.1Terms of Reference(1) To pr
- Page 24 and 25: 2.2.1 introduction2.1.1 This chapte
- Page 26 and 27: 2.2: OF THEPROJECTS AND POLICIESFOR
- Page 28 and 29: Transport Networks2.5.2 Description
- Page 30 and 31: 2.6.11 Operational Evaluation—The
- Page 32 and 33: 3.1GO OLicensed Vehicle Fleets (a]P
- Page 34 and 35: Table 3.3 VEHICLE(Dollars per year)
- Page 36 and 37: 3.2.7 The car and motorcycle fleet
- Page 38 and 39: 3.2.14 The non-van goods vehicle fl
- Page 40 and 41: 3.2.23 Use of Light Vans as Private
- Page 42 and 43: 3.3 Road Usage and Road Constructio
- Page 44 and 45: FIGURE 3.11:TRAFFIC IN URBAN HONG K
- Page 46 and 47: FIGURE 3.14:TRAFFIC IN THE NEW TERR
- Page 48 and 49: Table 3.6 CROSS HARBOUR TUNNEL TOLL
- Page 50 and 51: 3.5 Public Transport Patronage3.5.1
- Page 52 and 53: 3.5.4 The growth in rail transport
- Page 54 and 55: taxi productivity. The average paid
- Page 56 and 57: 4.4.1 introduction4.1.1 Demand for
- Page 58 and 59: Table 4.2DISTRIBUTION OF POPULATION
- Page 60 and 61: AreaTable 4.4Hong Kong islandKowioo
- Page 62 and 63: 4.2.14 An additional 425 000 jobs i
- Page 64 and 65: 4.3(1986-2001)Growth Over 1988Perio
- Page 66 and 67: included in the financial costs. Pe
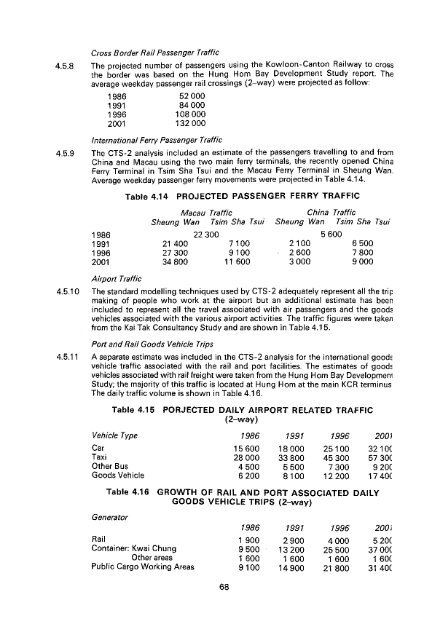
- Page 68 and 69: 4.5 International Traffic4.5.1 Proj
- Page 72 and 73: Table 4.17IN(1971-1989)HighwayPrice
- Page 74 and 75: contribution of Government equity t
- Page 76 and 77: 5. FORECASTS OF THE TRANSPORT SCENE
- Page 78 and 79: FIGURE 5.2:PROJECTED DAILY TRIP MAK
- Page 80 and 81: FIGURE 5.3: 1986 GENERATIONS AND AT
- Page 82 and 83: FIGURE 5.5: PERSON TRAVEL DEMAND(CO
- Page 84 and 85: Table 5.4PROJECTIONS OF DAILY TRIP
- Page 86 and 87: Table 5.5 SCHEDULED PUBLIC BY(thous
- Page 88 and 89: • FANLING/SHEUNG SHUIRMA ON SHANH
- Page 90 and 91: Cars and taxis 1.00Minibus/Special
- Page 92 and 93: LEGEND V/C Ratio Range• 1.1 - 1.2
- Page 94 and 95: •Vf'rLEGEND V/C Ratio Range> 1.1
- Page 96 and 97: FIGURE 5.13:TRAFFIC SPEEDS BY ROAD
- Page 98 and 99: 6. OF6.1 Introduction6.1.1 This cha
- Page 100 and 101: LEGENDMajor Committed Road ProjectK
- Page 102 and 103: LEGENDCandidate Road ProjectKowloon
- Page 104 and 105: A V/C ratio of 1.0 or less indicate
- Page 106 and 107: Table 6.3 SUMMARY OF HIGHWAY PORJEC
- Page 108 and 109: 6.5.1 2 The traffic implications of
- Page 110 and 111: 6.5.27 it is estimated that traffic
- Page 112 and 113: 6.7 and Airport Tunnel6.7.1 The Hun
- Page 114 and 115: 6.9.5 Conclusions— This is likely
- Page 116 and 117: 6.4(1988 Prices)ProjectLocFinancial
- Page 118 and 119: sufficient detail to permit compute
- Page 120 and 121:
LEGENDMTR £_EHC LRT(under vL} cons
- Page 122 and 123:
7.1Peak TramHong KongTramwaysKowloo
- Page 124 and 125:
MTR/KCR Interchange7.2.14 A key tra
- Page 126 and 127:
day, particularly in the peak hour.
- Page 128 and 129:
Impacts on Urban Development7.3.28
- Page 130 and 131:
7.4.2 The East Kowloon Line would s
- Page 132 and 133:
7.4.1 2 Both the financial return a
- Page 134 and 135:
7.5.17 Patronage and economic resul
- Page 136 and 137:
Rail Operations7.6.15 Two proposals
- Page 138 and 139:
passenger services. Also, while lig
- Page 140 and 141:
.S.Bi ne economic evaluation or tne
- Page 142 and 143:
Conclusions7.9.15 At the projected
- Page 144 and 145:
7.11.4 With an extension to Star Fe
- Page 146 and 147:
7.13.7 It is estimated that the LRT
- Page 148 and 149:
Conclusions7.14.13 Both harbour cro
- Page 150 and 151:
7.15.14 Financial support for the n
- Page 152 and 153:
FIGURE 8.1: PASSENGER TRANSPORT BY
- Page 154 and 155:
Railways8.2.6 Rail services began t
- Page 156 and 157:
Table 8.2PROJECTED DEMAND FOR SCHED
- Page 158 and 159:
FANLING/SHEUNG SHUIYUENLONGMA ON SH
- Page 160 and 161:
severe on the MTR island Line where
- Page 162 and 163:
8.4.10 The KCR main Sine is expecte
- Page 164 and 165:
Cross Harbour Bus Operations8.5.9 T
- Page 166 and 167:
8.7.3 In the New Territories, the r
- Page 168 and 169:
ail corridor is now operating at fu
- Page 170 and 171:
urban area, the short term means of
- Page 172 and 173:
(2) More vehicles are required to d
- Page 174 and 175:
are classified under Vehicle Owners
- Page 176 and 177:
9.5.5 Supplementary Licences—Thes
- Page 178 and 179:
9.5.19 Controls are required on bot
- Page 180 and 181:
Park and Hide9.6.4 This policy prom
- Page 182 and 183:
Alternative Scenarios for the Evalu
- Page 184 and 185:
9.7.18 Thus although the Centra! ec
- Page 186 and 187:
9.3 INNumber of vehs (thous)CarsTax
- Page 188 and 189:
Table 9.4ON(Increases in goods vehi
- Page 190 and 191:
9.11.3 The specific scheme chosen w
- Page 192 and 193:
Table 9.5(Similar to Scheme B inves
- Page 194 and 195:
traffic assessments. If the increas
- Page 196 and 197:
10 ON10.1 Introduction10.1.1 This c
- Page 198 and 199:
10.2.9 There are clearly some possi
- Page 200 and 201:
Railway Funding10.3.11 An expenditu
- Page 202 and 203:
Private Car Controls10.5.9 It is re
- Page 204 and 205:
c:,LEGEND V/C Ratio Range1.1 - 1.2>
- Page 206 and 207:
10.6.4 Several roads are projected
- Page 208 and 209:
o1991 Committed1996 Recommended Str
- Page 210 and 211:
operation and operator. Much depend
- Page 212 and 213:
ANNEX 10.1PROJECTIONS OF THE VEHICL
- Page 214 and 215:
ANNEX 10.4BY(thousand vehicles per
- Page 216 and 217:
TOC