Untitled - HKU Libraries - The University of Hong Kong
Untitled - HKU Libraries - The University of Hong Kong
Untitled - HKU Libraries - The University of Hong Kong
- No tags were found...

Create successful ePaper yourself
Turn your PDF publications into a flip-book with our unique Google optimized e-Paper software.
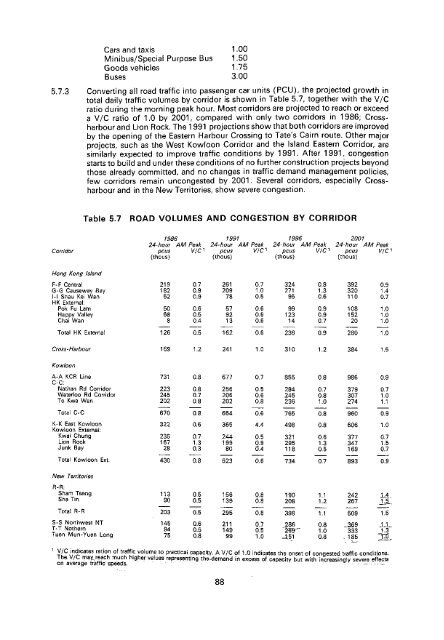
Cars and taxis 1.00Minibus/Special Purpose Bus 1.50Goods vehicles 1.75Buses 3.005.7.3 Converting ali road traffic into passenger car units (PCU), the projected growth intotal daily traffic volumes by corridor is shown in Table 5.7, together with the V/Cratio during the morning peak hour. Most corridors are projected to reach or exceeda V/C ratio <strong>of</strong> 1.0 by 2001, compared with only two corridors in 1986; Crossharbourand Lion Rock. <strong>The</strong> 1991 projections show that both corridors are improvedby the opening <strong>of</strong> the Eastern Harbour Crossing to Tate's Cairn route. Other majorprojects, such as the West Kowloon Corridor and the island Eastern Corridor, aresimilarly expected to improve traffic conditions by 1991. After 1991, congestionstarts to build and under these conditions <strong>of</strong> no further construction projects beyondthose already committed, and no changes in traffic demand management policies,few corridors remain uncongested by 2001. Several corridors, especially Crossharbourand in the New Territories, show severe congestion.Table 5.7BY1986 1991 1996 200124-hour AM Peak 24-hour AM Peak 24-hour AM Peak 24-hour AM PeakCorridor pcus V/C 1 pcus 1//C 1 pcus V/C 1 pcus V/C 1(thous) (thous) (thous) (thous)<strong>Hong</strong> <strong>Kong</strong> IslandF-F Central 219 0.7 261 0.7 324 0.8 392 0.9G-G Causeway Bay 182 0.9 209 1.0 271 1.3 320 1.4l-l Shau Kei Wan 52 0.9 78 0.5 95 0.6 110 0.7HK External:Pok Fu Lam 50 0.6 57 0.6 99 0.9 108 1.0Happy Valley 68 0.5 92 0.6 123 0.9 152 1.0Chai Wan 8 0.4 13 0.6 14 0.7 20 10Total HK External 126 0.5 162 0.6 236 0.9 280 1.0Cross-Harbour 169 1.2 241 1.0 310 1.2 384 1.5KowloonA-A KCR Line 731 0.8 677 0.7 855 0 8 986 0 9C-C:Nathan Rd Corridor 223 0.8 256 0.5 284 0.7 379 0.7Waterloo Rd Corridor 245 0.7 206 0.6 245 0 8 307 1 0To Kwa Wan 202 0.8 202 0.8 236 1.0 274 1.1Total C-C 670 0.8 664 0.6 765 0.8 960 0.9K-K East Kowloon 322 0.6 365 4.4 498 0.8 606 1.0Kowloon External:Kwai Chung 235 0.7 244 0.5 321 0.6 377 0.7Lion Rock 167 1.3 199 0.9 295 1.3 347 1.5Junk Bay 28 0.3 80 (5.4 118 0.5 169 0.7Total Kowloon Ext. 430 0.8 523 0.6 734 0.7 893 0.9New TerritoriesR-R:Sham TsengSha Tin11390Q.50.51561390.80.81902081.11.2242267J.4T.5Total R ' R 203 0.5 295 0.8 398 1.1 509 1.5S-S Northwest NT 145 0.6 211 0.7 286 08 369 1.1T-T Nothern 94 0.5 149 0.5 "269"""" l!o "333 T3Tuen Mun-Yuen Long 75 0.8 99 1.0 451 0.8 ,185 'Y/ C w n^cates rati °u n <strong>of</strong> *?*£!? volume to Poetical capacity. A V/C <strong>of</strong> 1.0 indicates the onset <strong>of</strong> congested traffic conditions.<strong>The</strong> V/C mayjeach much higher values representing the-demand in excess <strong>of</strong> capacity but with increasingly severe effectson average traffic speeds..."....» y ........88