Untitled - HKU Libraries - The University of Hong Kong
Untitled - HKU Libraries - The University of Hong Kong
Untitled - HKU Libraries - The University of Hong Kong
- No tags were found...

You also want an ePaper? Increase the reach of your titles
YUMPU automatically turns print PDFs into web optimized ePapers that Google loves.
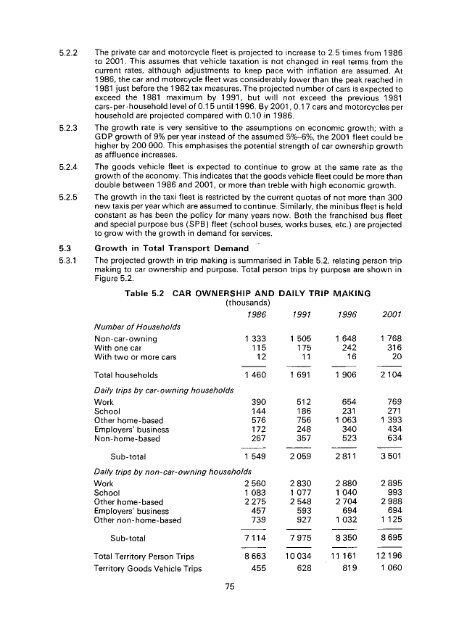
5.2.2 <strong>The</strong> private car and motorcycle fleet is projected to increase to 2.5 times from 1986to 2001. This assumes that vehicle taxation is not changed sn real terms from thecurrent rates, although adjustments to keep pace with inflation are assumed. At1986, the car and motorcycle fleet was considerably lower than the peak reached in1981 just before the 1 982 tax measures. <strong>The</strong> projected number <strong>of</strong> cars is expected toexceed the 1981 maximum by 1991, but will not exceed the previous 1981cars-per-household level <strong>of</strong> 0.1 5 until 1996. By 2001, 0.1 7 cars and motorcycles perhousehold are projected compared with 0.10 in 1986.5.2.3 <strong>The</strong> growth rate is very sensitive to the assumptions on economic growth; with aGDP growth <strong>of</strong> 9% per year instead <strong>of</strong> the assumed 5%-6%, the 2001 fleet could behigher by 200 000. This emphasises the potential strength <strong>of</strong> car ownership growthas affluence increases.5.2.4 <strong>The</strong> goods vehicle fleet is expected to continue to grow at the same rate as thegrowth <strong>of</strong> the economy. This indicates that the goods vehicle fleet could be more thandouble between 1986 and 2001, or more than treble with high economic growth.5.2.5 <strong>The</strong> growth in the taxi fleet is restricted by the current quotas <strong>of</strong> not more than 300new taxis per year which are assumed to continue. Similarly, the minibus fleet is heldconstant as has been the policy for many years now. Both the franchised bus fleetand special purpose bus (SPB) fleet (school buses, works buses, etc.) are projectedto grow with the growth in demand for services.5.3 Growth in Total Transport Demand5.3.1 <strong>The</strong> projected growth in trip making is summarised in Table 5.2, relating person tripmaking to car ownership and purpose. Total person trips by purpose are shown inFigure 5.2.Table 5.2Number <strong>of</strong> HouseholdsNon-car-owningWith one carWith two or more cars(thousands)1986 1991 1996 20011 333115121 505175111 648242161 76831620Total householdsDaily trips by car-owning householdsWork 390School 144Other home-based 576Employers'business 172Non-home-based 2671 460 1 691 1 906 21045121867562483576542311 0633405237692711 393434634Sub-total 1 5492059 281' 3501Daily trips by non-car-owning householdsWork 2 560School 1 083Other home-based 2 275Employers' business 457Other non-home-based 73928301 077254859392728801 04027046941 032289599329886941 125Sub-total7114797583508695Total Territory Person TripsTerritory Goods Vehicle Trips86634551003462811 161819121961 06075