Untitled - HKU Libraries - The University of Hong Kong
Untitled - HKU Libraries - The University of Hong Kong
Untitled - HKU Libraries - The University of Hong Kong
- No tags were found...
You also want an ePaper? Increase the reach of your titles
YUMPU automatically turns print PDFs into web optimized ePapers that Google loves.
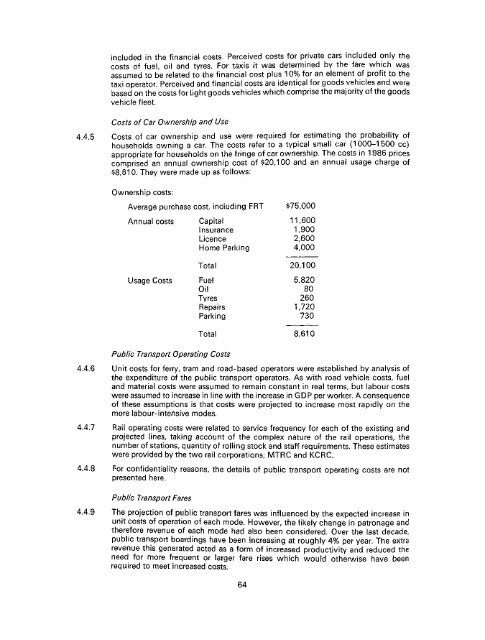
included in the financial costs. Perceived costs for private cars included only thecosts <strong>of</strong> fuel oil and tyres. For taxis it was determined by the fare which wasassumed to be related to the financial cost plus 10% for an element <strong>of</strong> pr<strong>of</strong>it to thetaxi operator. Perceived and financial costs are identical for goods vehicles and werebased on the costs for iightgoods vehicles which comprise the majority <strong>of</strong> the goodsvehicle fleet.Costs <strong>of</strong> Car Ownership and Use4.4.5 Costs <strong>of</strong> car ownership and use were required for estimating the probability <strong>of</strong>households owning a car. <strong>The</strong> costs refer to a typical small car (1000-1500 cc)appropriate for households on the fringe <strong>of</strong> car ownership. <strong>The</strong> costs in 1986 pricescomprised an annual ownership cost <strong>of</strong> $20,100 and an annual usage charge <strong>of</strong>$8,610. <strong>The</strong>y were made up as follows:Ownership costs:Average purchase cost, including FRT $75,000Annual costs Capital 11,600Insurance 1,900Licence 2,600Home Parking 4,000Total 20,100Usage Costs Fuel 5,820Oil 80Tyres 260Repairs 1,720Parking 730Public Transport Operating CostsTotal 8,6104.4.6 Unit costs for ferry, tram and road-based operators were established by analysis <strong>of</strong>the expenditure <strong>of</strong> the public transport operators. As with road vehicle costs, fueland material costs were assumed to remain constant in real terms, but labour costswere assumed to increase in line with the increase in GDP per worker. A consequence<strong>of</strong> these assumptions is that costs were projected to increase most rapidly on themore labour-intensive modes.4.4.7 Rail operating costs were related to service frequency for each <strong>of</strong> the existing andprojected lines, taking account <strong>of</strong> the complex nature <strong>of</strong> the rail operations, thenumber <strong>of</strong> stations, quantity <strong>of</strong> roiling stock and staff requirements. <strong>The</strong>se estimateswere provided by the two rail corporations; MTRC and KCRC.4.4.8 For confidentiality reasons, the details <strong>of</strong> public transport operating costs are notpresented here.Public Transport Fares4.4.9 <strong>The</strong> projection <strong>of</strong> public transport fares was influenced by the expected increase inunit costs <strong>of</strong> operation <strong>of</strong> each mode. However, the likely change in patronage andtherefore revenue <strong>of</strong> each mode had also been considered. Over the last decade,public transport boardings have been increasing at roughly 4% per year. <strong>The</strong> extrarevenue this generated acted as a form <strong>of</strong> increased productivity and reduced theneed for more frequent or larger fare rises which would otherwise have beenrequired to meet increased costs.64


