Untitled - HKU Libraries - The University of Hong Kong
Untitled - HKU Libraries - The University of Hong Kong
Untitled - HKU Libraries - The University of Hong Kong
- No tags were found...

Create successful ePaper yourself
Turn your PDF publications into a flip-book with our unique Google optimized e-Paper software.
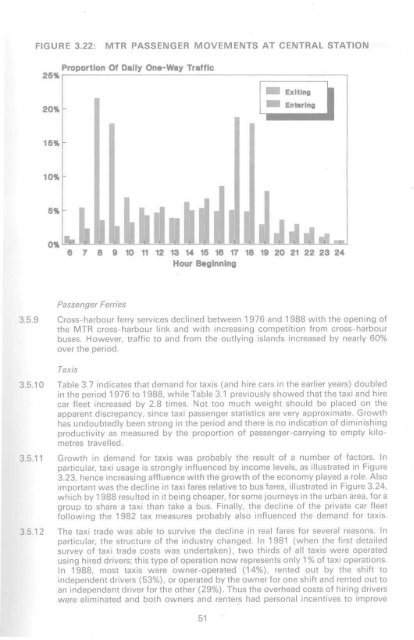
FIGURE 3.22:MTR PASSENGER MOVEMENTS AT CENTRAL STATIONProportion Of Dally One-Way Traffic25%20%ExitingEntering15%10%5%0%6 7 8 9 10 11 12 13 14 15 16 17 18 19 20 21 22 23 24Hour BeginningPassenger Ferries3.5.9 Cross-harbour ferry services declined between 1976 and 1988 with the opening <strong>of</strong>the MTR cross-harbour link and with increasing competition from cross-harbourbuses. However, traffic to and from the outlying islands increased by nearly 60%over the period.Taxis3.5.10 Table 3.7 indicates that demand for taxis (and hire cars in the earlier years) doubledin the period 1976 to 1988, while Table 3.1 previously showed that the taxi and hirecar fleet increased by 2.8 times. Not too much weight should be placed on theapparent discrepancy, since taxi passenger statistics are very approximate. Growthhas undoubtedly been strong in the period and there is no indication <strong>of</strong> diminishingproductivity as measured by the proportion <strong>of</strong> passenger-carrying to empty kilometrestravelled.3.5.11 Growth in demand for taxis was probably the result <strong>of</strong> a number <strong>of</strong> factors. Inparticular, taxi usage is strongly influenced by income levels, as illustrated in Figure3.23, hence increasing affluence with the growth <strong>of</strong> the economy played a role. Alsoimportant was the decline in taxi fares relative to bus fares, illustrated in Figure 3.24,which by 1988 resulted in it being cheaper, for some journeys in the urban area, for agroup to share a taxi than take a bus. Finally, the decline <strong>of</strong> the private car fleetfollowing the 1982 tax measures probably also influenced the demand for taxis.3.5.12 <strong>The</strong> taxi trade was able to survive the decline in real fares for several reasons. Inparticular, the structure <strong>of</strong> the industry changed. In 1981 (when the first detailedsurvey <strong>of</strong> taxi trade costs was undertaken), two thirds <strong>of</strong> all taxis were operatedusing hired drivers; this type <strong>of</strong> operation now represents only 1 % <strong>of</strong> taxi operations.In 1988, most taxis were owner-operated (14%), rented out by the shift toindependent drivers (53%), or operated by the owner for one shift and rented out toan independent driver for the other (29%). Thus the overhead costs <strong>of</strong> hiring driverswere eliminated and both owners and renters had personal incentives to improve