Getting Started

Create successful ePaper yourself
Turn your PDF publications into a flip-book with our unique Google optimized e-Paper software.
7 • ARENA VISUAL DESIGNER<br />
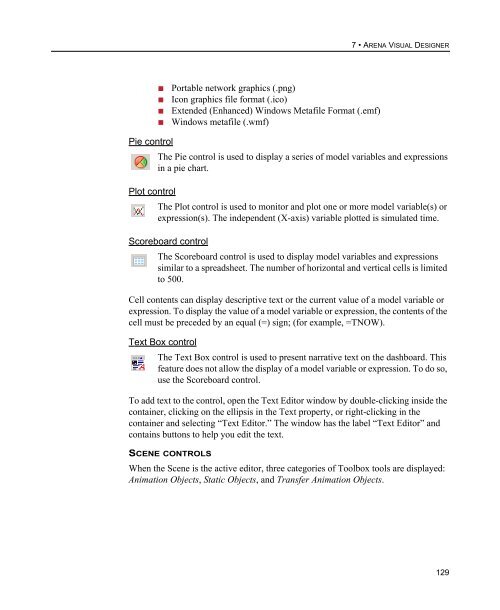
Pie control<br />
Plot control<br />
• Portable network graphics (.png)<br />
• Icon graphics file format (.ico)<br />
• Extended (Enhanced) Windows Metafile Format (.emf)<br />
• Windows metafile (.wmf)<br />
The Pie control is used to display a series of model variables and expressions<br />
in a pie chart.<br />
The Plot control is used to monitor and plot one or more model variable(s) or<br />
expression(s). The independent (X-axis) variable plotted is simulated time.<br />
Scoreboard control<br />
The Scoreboard control is used to display model variables and expressions<br />
similar to a spreadsheet. The number of horizontal and vertical cells is limited<br />
to 500.<br />
Cell contents can display descriptive text or the current value of a model variable or<br />
expression. To display the value of a model variable or expression, the contents of the<br />
cell must be preceded by an equal (=) sign; (for example, =TNOW).<br />
Text Box control<br />
The Text Box control is used to present narrative text on the dashboard. This<br />
feature does not allow the display of a model variable or expression. To do so,<br />
use the Scoreboard control.<br />
To add text to the control, open the Text Editor window by double-clicking inside the<br />
container, clicking on the ellipsis in the Text property, or right-clicking in the<br />
container and selecting “Text Editor.” The window has the label “Text Editor” and<br />
contains buttons to help you edit the text.<br />
SCENE CONTROLS<br />
When the Scene is the active editor, three categories of Toolbox tools are displayed:<br />
Animation Objects, Static Objects, and Transfer Animation Objects.<br />
129