Getting Started

Create successful ePaper yourself
Turn your PDF publications into a flip-book with our unique Google optimized e-Paper software.
7 • ARENA VISUAL DESIGNER<br />
4. From the Toolbox, drag the Plot control into the container that states “Drop<br />
Toolbox Control here.” Once a control is placed, the properties associated with it<br />
can be edited in the Properties window.<br />
5. In the Properties window, click on the Data properties right column, then select<br />
the ellipsis (...). This will be the first field listed in the Properties window. The<br />
Data-Series Editor dialog box will open.<br />
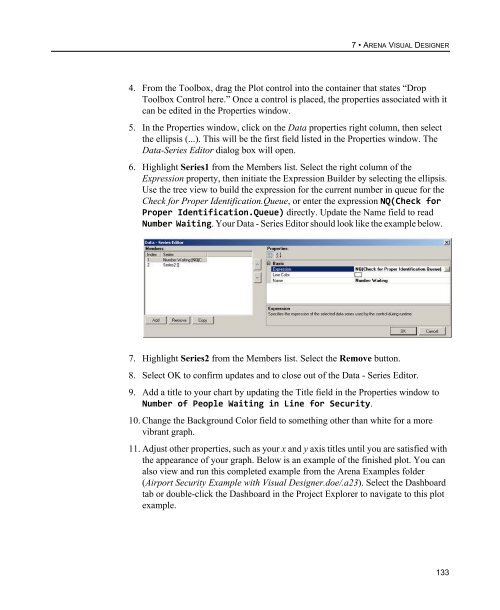
6. Highlight Series1 from the Members list. Select the right column of the<br />
Expression property, then initiate the Expression Builder by selecting the ellipsis.<br />
Use the tree view to build the expression for the current number in queue for the<br />
Check for Proper Identification.Queue, or enter the expression NQ(Check for<br />
Proper Identification.Queue) directly. Update the Name field to read<br />
Number Waiting. Your Data - Series Editor should look like the example below.<br />
7. Highlight Series2 from the Members list. Select the Remove button.<br />
8. Select OK to confirm updates and to close out of the Data - Series Editor.<br />
9. Add a title to your chart by updating the Title field in the Properties window to<br />
Number of People Waiting in Line for Security.<br />
10. Change the Background Color field to something other than white for a more<br />
vibrant graph.<br />
11. Adjust other properties, such as your x and y axis titles until you are satisfied with<br />
the appearance of your graph. Below is an example of the finished plot. You can<br />
also view and run this completed example from the Arena Examples folder<br />
(Airport Security Example with Visual Designer.doe/.a23). Select the Dashboard<br />
tab or double-click the Dashboard in the Project Explorer to navigate to this plot<br />
example.<br />
133