

Four degrees and beyond: the potential for a global ... - Amper
Four degrees and beyond: the potential for a global ... - Amper
Four degrees and beyond: the potential for a global ... - Amper

You also want an ePaper? Increase the reach of your titles
YUMPU automatically turns print PDFs into web optimized ePapers that Google loves.
(a) 90° N<br />
45° N<br />
0<br />
45° S<br />
(c) 90° N<br />
45° N<br />
0<br />
45° S<br />
Temperature <strong>and</strong> precipitation change 93<br />
(b) 90° N<br />
45° N<br />
45° S<br />
90° S<br />
90° S<br />
180° 90° W 0 90° E 180° 90° W 0 90° E<br />
(d) 90° N<br />
45° N<br />
45° S<br />
90° S<br />
90° S<br />
180° 90° W 0 90° E 180° 90° W 0 90° E<br />
–50 –30 –20 –15 –10 –5 5 10 15 20 30 50<br />
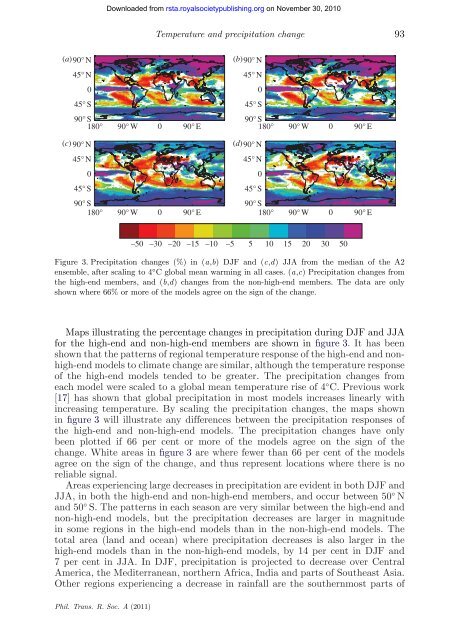
Figure 3. Precipitation changes (%) in (a,b) DJF <strong>and</strong> (c,d) JJA from <strong>the</strong> median of <strong>the</strong> A2<br />
ensemble, after scaling to 4 ◦ C <strong>global</strong> mean warming in all cases. (a,c) Precipitation changes from<br />
<strong>the</strong> high-end members, <strong>and</strong> (b,d) changes from <strong>the</strong> non-high-end members. The data are only<br />
shown where 66% or more of <strong>the</strong> models agree on <strong>the</strong> sign of <strong>the</strong> change.<br />
Maps illustrating <strong>the</strong> percentage changes in precipitation during DJF <strong>and</strong> JJA<br />
<strong>for</strong> <strong>the</strong> high-end <strong>and</strong> non-high-end members are shown in figure 3. It has been<br />
shown that <strong>the</strong> patterns of regional temperature response of <strong>the</strong> high-end <strong>and</strong> nonhigh-end<br />
models to climate change are similar, although <strong>the</strong> temperature response<br />
of <strong>the</strong> high-end models tended to be greater. The precipitation changes from<br />
each model were scaled to a <strong>global</strong> mean temperature rise of 4 ◦ C. Previous work<br />
[17] has shown that <strong>global</strong> precipitation in most models increases linearly with<br />
increasing temperature. By scaling <strong>the</strong> precipitation changes, <strong>the</strong> maps shown<br />
in figure 3 will illustrate any differences between <strong>the</strong> precipitation responses of<br />
<strong>the</strong> high-end <strong>and</strong> non-high-end models. The precipitation changes have only<br />
been plotted if 66 per cent or more of <strong>the</strong> models agree on <strong>the</strong> sign of <strong>the</strong><br />
change. White areas in figure 3 are where fewer than 66 per cent of <strong>the</strong> models<br />
agree on <strong>the</strong> sign of <strong>the</strong> change, <strong>and</strong> thus represent locations where <strong>the</strong>re is no<br />
reliable signal.<br />
Areas experiencing large decreases in precipitation are evident in both DJF <strong>and</strong><br />
JJA, in both <strong>the</strong> high-end <strong>and</strong> non-high-end members, <strong>and</strong> occur between 50 ◦ N<br />
<strong>and</strong> 50 ◦ S. The patterns in each season are very similar between <strong>the</strong> high-end <strong>and</strong><br />
non-high-end models, but <strong>the</strong> precipitation decreases are larger in magnitude<br />
in some regions in <strong>the</strong> high-end models than in <strong>the</strong> non-high-end models. The<br />
total area (l<strong>and</strong> <strong>and</strong> ocean) where precipitation decreases is also larger in <strong>the</strong><br />
high-end models than in <strong>the</strong> non-high-end models, by 14 per cent in DJF <strong>and</strong><br />
7 per cent in JJA. In DJF, precipitation is projected to decrease over Central<br />
America, <strong>the</strong> Mediterranean, nor<strong>the</strong>rn Africa, India <strong>and</strong> parts of Sou<strong>the</strong>ast Asia.<br />
O<strong>the</strong>r regions experiencing a decrease in rainfall are <strong>the</strong> sou<strong>the</strong>rnmost parts of<br />
Phil. Trans. R. Soc. A (2011)<br />
Downloaded from<br />
rsta.royalsocietypublishing.org on November 30, 2010<br />
0<br />
0


