

Four degrees and beyond: the potential for a global ... - Amper
Four degrees and beyond: the potential for a global ... - Amper
Four degrees and beyond: the potential for a global ... - Amper

You also want an ePaper? Increase the reach of your titles
YUMPU automatically turns print PDFs into web optimized ePapers that Google loves.
30 K. Anderson <strong>and</strong> A. Bows<br />
(a) 50<br />
(b) (c)<br />
GtCO 2 yr –1<br />
40<br />
30<br />
20<br />
10<br />
0<br />
2000<br />
2020 2040 2060<br />
year<br />
2080 2100 2000 2020 2040 2060<br />
year<br />
2080 2100 2000 2020 2040 2060<br />
year<br />
2080 2100<br />
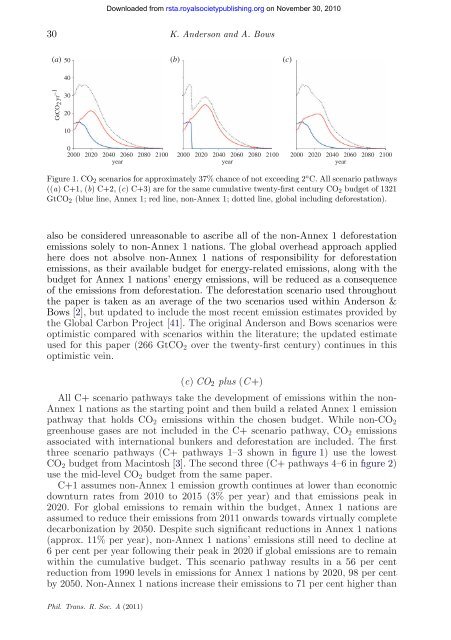
Figure 1. CO2 scenarios <strong>for</strong> approximately 37% chance of not exceeding 2 ◦ C. All scenario pathways<br />
((a) C+1, (b) C+2, (c) C+3) are <strong>for</strong> <strong>the</strong> same cumulative twenty-first century CO2 budget of 1321<br />
GtCO2 (blue line, Annex 1; red line, non-Annex 1; dotted line, <strong>global</strong> including de<strong>for</strong>estation).<br />
also be considered unreasonable to ascribe all of <strong>the</strong> non-Annex 1 de<strong>for</strong>estation<br />
emissions solely to non-Annex 1 nations. The <strong>global</strong> overhead approach applied<br />
here does not absolve non-Annex 1 nations of responsibility <strong>for</strong> de<strong>for</strong>estation<br />
emissions, as <strong>the</strong>ir available budget <strong>for</strong> energy-related emissions, along with <strong>the</strong><br />
budget <strong>for</strong> Annex 1 nations’ energy emissions, will be reduced as a consequence<br />
of <strong>the</strong> emissions from de<strong>for</strong>estation. The de<strong>for</strong>estation scenario used throughout<br />
<strong>the</strong> paper is taken as an average of <strong>the</strong> two scenarios used within Anderson &<br />
Bows [2], but updated to include <strong>the</strong> most recent emission estimates provided by<br />
<strong>the</strong> Global Carbon Project [41]. The original Anderson <strong>and</strong> Bows scenarios were<br />
optimistic compared with scenarios within <strong>the</strong> literature; <strong>the</strong> updated estimate<br />
used <strong>for</strong> this paper (266 GtCO2 over <strong>the</strong> twenty-first century) continues in this<br />
optimistic vein.<br />
(c) CO2 plus (C +)<br />
All C+ scenario pathways take <strong>the</strong> development of emissions within <strong>the</strong> non-<br />
Annex 1 nations as <strong>the</strong> starting point <strong>and</strong> <strong>the</strong>n build a related Annex 1 emission<br />
pathway that holds CO2 emissions within <strong>the</strong> chosen budget. While non-CO2<br />
greenhouse gases are not included in <strong>the</strong> C+ scenario pathway, CO2 emissions<br />
associated with international bunkers <strong>and</strong> de<strong>for</strong>estation are included. The first<br />
three scenario pathways (C+ pathways 1–3 shown in figure 1) use <strong>the</strong> lowest<br />
CO2 budget from Macintosh [3]. The second three (C+ pathways 4–6 in figure 2)<br />
use <strong>the</strong> mid-level CO2 budget from <strong>the</strong> same paper.<br />
C+1 assumes non-Annex 1 emission growth continues at lower than economic<br />
downturn rates from 2010 to 2015 (3% per year) <strong>and</strong> that emissions peak in<br />
2020. For <strong>global</strong> emissions to remain within <strong>the</strong> budget, Annex 1 nations are<br />
assumed to reduce <strong>the</strong>ir emissions from 2011 onwards towards virtually complete<br />
decarbonization by 2050. Despite such significant reductions in Annex 1 nations<br />
(approx. 11% per year), non-Annex 1 nations’ emissions still need to decline at<br />
6 per cent per year following <strong>the</strong>ir peak in 2020 if <strong>global</strong> emissions are to remain<br />
within <strong>the</strong> cumulative budget. This scenario pathway results in a 56 per cent<br />
reduction from 1990 levels in emissions <strong>for</strong> Annex 1 nations by 2020, 98 per cent<br />
by 2050. Non-Annex 1 nations increase <strong>the</strong>ir emissions to 71 per cent higher than<br />
Phil. Trans. R. Soc. A (2011)<br />
Downloaded from<br />
rsta.royalsocietypublishing.org on November 30, 2010


