

Four degrees and beyond: the potential for a global ... - Amper
Four degrees and beyond: the potential for a global ... - Amper
Four degrees and beyond: the potential for a global ... - Amper

You also want an ePaper? Increase the reach of your titles
YUMPU automatically turns print PDFs into web optimized ePapers that Google loves.
122 P. K. Thornton et al.<br />
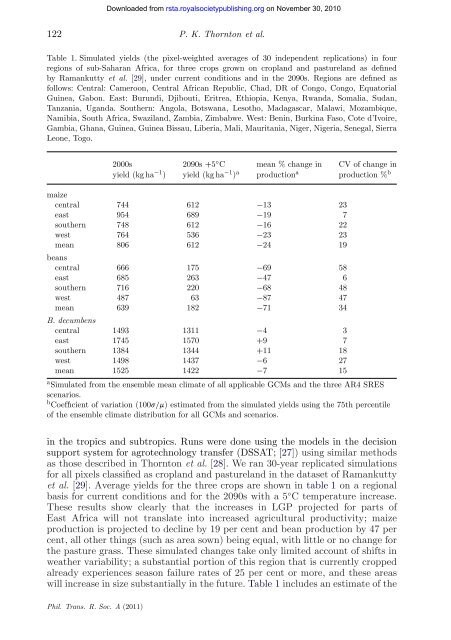
Table 1. Simulated yields (<strong>the</strong> pixel-weighted averages of 30 independent replications) in four<br />
regions of sub-Saharan Africa, <strong>for</strong> three crops grown on cropl<strong>and</strong> <strong>and</strong> pasturel<strong>and</strong> as defined<br />
by Ramankutty et al. [29], under current conditions <strong>and</strong> in <strong>the</strong> 2090s. Regions are defined as<br />
follows: Central: Cameroon, Central African Republic, Chad, DR of Congo, Congo, Equatorial<br />
Guinea, Gabon. East: Burundi, Djibouti, Eritrea, Ethiopia, Kenya, Rw<strong>and</strong>a, Somalia, Sudan,<br />
Tanzania, Ug<strong>and</strong>a. Sou<strong>the</strong>rn: Angola, Botswana, Lesotho, Madagascar, Malawi, Mozambique,<br />
Namibia, South Africa, Swazil<strong>and</strong>, Zambia, Zimbabwe. West: Benin, Burkina Faso, Cote d’Ivoire,<br />
Gambia, Ghana, Guinea, Guinea Bissau, Liberia, Mali, Mauritania, Niger, Nigeria, Senegal, Sierra<br />
Leone, Togo.<br />
2000s 2090s +5 ◦ C mean % change in CV of change in<br />
yield (kg ha −1 ) yield (kg ha −1 ) a production a production % b<br />
maize<br />
central 744 612 −13 23<br />
east 954 689 −19 7<br />
sou<strong>the</strong>rn 748 612 −16 22<br />
west 764 536 −23 23<br />
mean<br />
beans<br />
806 612 −24 19<br />
central 666 175 −69 58<br />
east 685 263 −47 6<br />
sou<strong>the</strong>rn 716 220 −68 48<br />
west 487 63 −87 47<br />
mean<br />
B. decumbens<br />
639 182 −71 34<br />
central 1493 1311 −4 3<br />
east 1745 1570 +9 7<br />
sou<strong>the</strong>rn 1384 1344 +11 18<br />
west 1498 1437 −6 27<br />
mean 1525 1422 −7 15<br />
aSimulated from <strong>the</strong> ensemble mean climate of all applicable GCMs <strong>and</strong> <strong>the</strong> three AR4 SRES<br />
scenarios.<br />
bCoefficient of variation (100s/m) estimated from <strong>the</strong> simulated yields using <strong>the</strong> 75th percentile<br />
of <strong>the</strong> ensemble climate distribution <strong>for</strong> all GCMs <strong>and</strong> scenarios.<br />
in <strong>the</strong> tropics <strong>and</strong> subtropics. Runs were done using <strong>the</strong> models in <strong>the</strong> decision<br />
support system <strong>for</strong> agrotechnology transfer (DSSAT; [27]) using similar methods<br />
as those described in Thornton et al. [28]. We ran 30-year replicated simulations<br />
<strong>for</strong> all pixels classified as cropl<strong>and</strong> <strong>and</strong> pasturel<strong>and</strong> in <strong>the</strong> dataset of Ramankutty<br />
et al. [29]. Average yields <strong>for</strong> <strong>the</strong> three crops are shown in table 1 on a regional<br />
basis <strong>for</strong> current conditions <strong>and</strong> <strong>for</strong> <strong>the</strong> 2090s with a 5 ◦ C temperature increase.<br />
These results show clearly that <strong>the</strong> increases in LGP projected <strong>for</strong> parts of<br />
East Africa will not translate into increased agricultural productivity; maize<br />
production is projected to decline by 19 per cent <strong>and</strong> bean production by 47 per<br />
cent, all o<strong>the</strong>r things (such as area sown) being equal, with little or no change <strong>for</strong><br />
<strong>the</strong> pasture grass. These simulated changes take only limited account of shifts in<br />
wea<strong>the</strong>r variability; a substantial portion of this region that is currently cropped<br />
already experiences season failure rates of 25 per cent or more, <strong>and</strong> <strong>the</strong>se areas<br />
will increase in size substantially in <strong>the</strong> future. Table 1 includes an estimate of <strong>the</strong><br />
Phil. Trans. R. Soc. A (2011)<br />
Downloaded from<br />
rsta.royalsocietypublishing.org on November 30, 2010


