

Four degrees and beyond: the potential for a global ... - Amper
Four degrees and beyond: the potential for a global ... - Amper
Four degrees and beyond: the potential for a global ... - Amper

Create successful ePaper yourself
Turn your PDF publications into a flip-book with our unique Google optimized e-Paper software.
56 N. H. A. Bowerman et al.<br />
(a)<br />
peak CO 2-induced warming (ºC)<br />
(c)<br />
peak CO 2-induced warming (ºC)<br />
4<br />
3<br />
2<br />
1<br />
0 1 2 3 4<br />
cumulative emissions to 2500 (TtC)<br />
4<br />
3<br />
2<br />
1<br />
0 1 2 3 4<br />
cumulative emissions to 2100 (TtC)<br />
(b)<br />
(d)<br />
0 1 2 3 4<br />
cumulative emissions to peak temp. (TtC)<br />
0 1 2 3 4<br />
cumulative emissions to 2200 (TtC)<br />
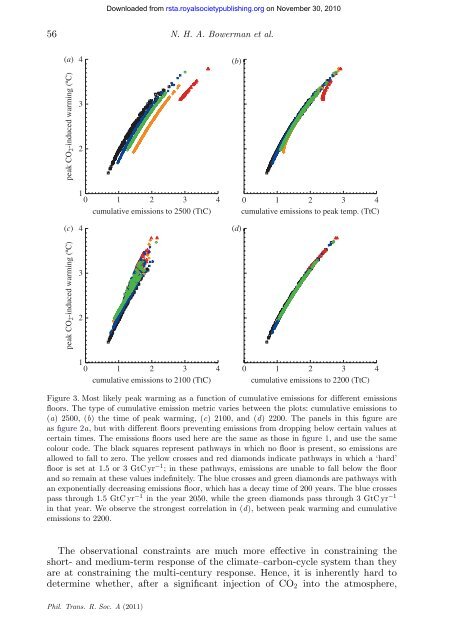
Figure 3. Most likely peak warming as a function of cumulative emissions <strong>for</strong> different emissions<br />
floors. The type of cumulative emission metric varies between <strong>the</strong> plots: cumulative emissions to<br />
(a) 2500, (b) <strong>the</strong> time of peak warming, (c) 2100, <strong>and</strong> (d) 2200. The panels in this figure are<br />
as figure 2a, but with different floors preventing emissions from dropping below certain values at<br />
certain times. The emissions floors used here are <strong>the</strong> same as those in figure 1, <strong>and</strong> use <strong>the</strong> same<br />
colour code. The black squares represent pathways in which no floor is present, so emissions are<br />
allowed to fall to zero. The yellow crosses <strong>and</strong> red diamonds indicate pathways in which a ‘hard’<br />
floor is set at 1.5 or 3 GtC yr −1 ; in <strong>the</strong>se pathways, emissions are unable to fall below <strong>the</strong> floor<br />
<strong>and</strong> so remain at <strong>the</strong>se values indefinitely. The blue crosses <strong>and</strong> green diamonds are pathways with<br />
an exponentially decreasing emissions floor, which has a decay time of 200 years. The blue crosses<br />
pass through 1.5 GtC yr −1 in <strong>the</strong> year 2050, while <strong>the</strong> green diamonds pass through 3 GtC yr −1<br />
in that year. We observe <strong>the</strong> strongest correlation in (d), between peak warming <strong>and</strong> cumulative<br />
emissions to 2200.<br />
The observational constraints are much more effective in constraining <strong>the</strong><br />
short- <strong>and</strong> medium-term response of <strong>the</strong> climate–carbon-cycle system than <strong>the</strong>y<br />
are at constraining <strong>the</strong> multi-century response. Hence, it is inherently hard to<br />
determine whe<strong>the</strong>r, after a significant injection of CO2 into <strong>the</strong> atmosphere,<br />
Phil. Trans. R. Soc. A (2011)<br />
Downloaded from<br />
rsta.royalsocietypublishing.org on November 30, 2010


