

Four degrees and beyond: the potential for a global ... - Amper
Four degrees and beyond: the potential for a global ... - Amper
Four degrees and beyond: the potential for a global ... - Amper

You also want an ePaper? Increase the reach of your titles
YUMPU automatically turns print PDFs into web optimized ePapers that Google loves.
60 N. H. A. Bowerman et al.<br />
(a)<br />
relative likelihood<br />
relative likelihood<br />
1.0<br />
0.8<br />
0.6<br />
0.4<br />
0.2<br />
0<br />
(d) 1.5 TtC totals with (e) 1.5 TtC totals with ( f )<br />
1.0<br />
no emissions floors decaying emissions floors<br />
(g)<br />
relative likelihood<br />
0.8<br />
0.6<br />
0.4<br />
0.2<br />
0<br />
1.0<br />
0.8<br />
0.6<br />
0.4<br />
0.2<br />
0<br />
1 TtC totals with<br />
no emissions floors<br />
2 TtC totals with<br />
no emissions floors<br />
1 2 3 4<br />
peak warming (ºC)<br />
(b) 1 TtC totals with<br />
decaying emissions floors<br />
(c)<br />
(h)<br />
2 TtC totals with<br />
decaying emissions floors<br />
0 1 2 3 4<br />
peak warming (ºC)<br />
(i)<br />
1 TtC totals with<br />
hard emissions floors<br />
1.5 TtC totals with<br />
hard emissions floors<br />
2 TtC totals with<br />
hard emissions floors<br />
0 1 2 3 4<br />
peak warming (ºC)<br />
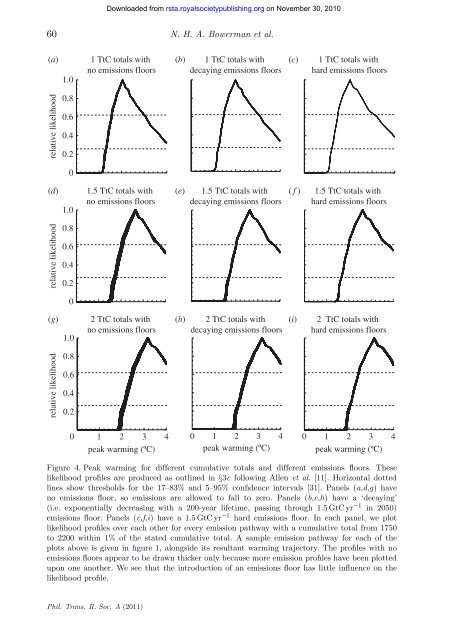
Figure 4. Peak warming <strong>for</strong> different cumulative totals <strong>and</strong> different emissions floors. These<br />
likelihood profiles are produced as outlined in §3c following Allen et al. [11]. Horizontal dotted<br />
lines show thresholds <strong>for</strong> <strong>the</strong> 17–83% <strong>and</strong> 5–95% confidence intervals [31]. Panels (a,d,g) have<br />
no emissions floor, so emissions are allowed to fall to zero. Panels (b,e,h) have a ‘decaying’<br />
(i.e. exponentially decreasing with a 200-year lifetime, passing through 1.5 GtC yr −1 in 2050)<br />
emissions floor. Panels (c,f,i) have a 1.5 GtC yr −1 hard emissions floor. In each panel, we plot<br />
likelihood profiles over each o<strong>the</strong>r <strong>for</strong> every emission pathway with a cumulative total from 1750<br />
to 2200 within 1% of <strong>the</strong> stated cumulative total. A sample emission pathway <strong>for</strong> each of <strong>the</strong><br />
plots above is given in figure 1, alongside its resultant warming trajectory. The profiles with no<br />
emissions floors appear to be drawn thicker only because more emission profiles have been plotted<br />
upon one ano<strong>the</strong>r. We see that <strong>the</strong> introduction of an emissions floor has little influence on <strong>the</strong><br />
likelihood profile.<br />
Phil. Trans. R. Soc. A (2011)<br />
Downloaded from<br />
rsta.royalsocietypublishing.org on November 30, 2010


