Four degrees and beyond: the potential for a global ... - Amper
Four degrees and beyond: the potential for a global ... - Amper
Four degrees and beyond: the potential for a global ... - Amper
Create successful ePaper yourself
Turn your PDF publications into a flip-book with our unique Google optimized e-Paper software.
48 N. H. A. Bowerman et al.<br />
a likelihood-based method is used to identify <strong>the</strong> values that give <strong>the</strong> best<br />
agreement with observations of <strong>the</strong> recent past or model studies with more<br />
complex coupled climate–carbon-cycle models [11].<br />
For <strong>the</strong> majority of this paper, we run one simulation <strong>for</strong> each selected<br />
emission pathway, using <strong>the</strong> parameters that were previously found to give<br />
<strong>the</strong> best agreement with observations <strong>and</strong> more complex models. The model is<br />
run between <strong>the</strong> years 1751 <strong>and</strong> 2500. By running large ensembles containing<br />
hundreds of different emission pathways, we can begin to analyse trends across<br />
emission pathways. This method allows us to ask questions, such as: ‘What is it<br />
about an emission pathway that controls <strong>the</strong> resulting peak rate of <strong>global</strong> mean<br />
temperature increase?’<br />
(a) Emission pathways<br />
We use emission pathways that follow <strong>the</strong> algorithm outlined by Allen<br />
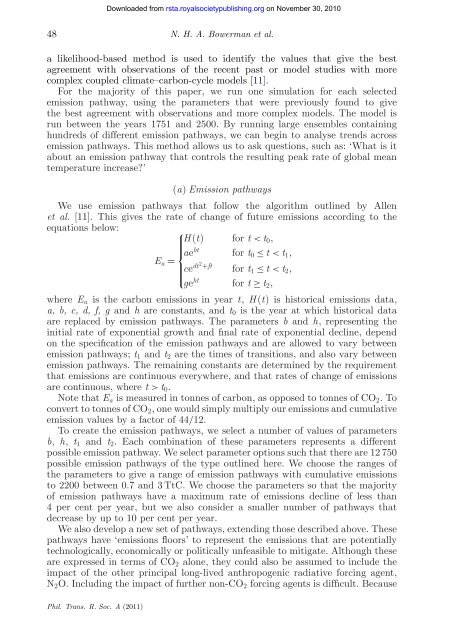
et al. [11]. This gives <strong>the</strong> rate of change of future emissions according to <strong>the</strong><br />
equations below:<br />
⎧<br />
H (t) <strong>for</strong> t < t0,<br />
⎪⎨ aebt <strong>for</strong> t0 ≤ t < t1,<br />
Ea =<br />
⎪⎩<br />
cedt2 +ft <strong>for</strong> t1 ≤ t < t2,<br />
geht <strong>for</strong> t ≥ t2,<br />
where Ea is <strong>the</strong> carbon emissions in year t, H (t) is historical emissions data,<br />
a, b, c, d, f, g <strong>and</strong> h are constants, <strong>and</strong> t0 is <strong>the</strong> year at which historical data<br />
are replaced by emission pathways. The parameters b <strong>and</strong> h, representing <strong>the</strong><br />
initial rate of exponential growth <strong>and</strong> final rate of exponential decline, depend<br />
on <strong>the</strong> specification of <strong>the</strong> emission pathways <strong>and</strong> are allowed to vary between<br />
emission pathways; t1 <strong>and</strong> t2 are <strong>the</strong> times of transitions, <strong>and</strong> also vary between<br />
emission pathways. The remaining constants are determined by <strong>the</strong> requirement<br />
that emissions are continuous everywhere, <strong>and</strong> that rates of change of emissions<br />
are continuous, where t > t0.<br />
Note that Ea is measured in tonnes of carbon, as opposed to tonnes of CO2. To<br />
convert to tonnes of CO2, one would simply multiply our emissions <strong>and</strong> cumulative<br />
emission values by a factor of 44/12.<br />
To create <strong>the</strong> emission pathways, we select a number of values of parameters<br />
b, h, t1 <strong>and</strong> t2. Each combination of <strong>the</strong>se parameters represents a different<br />
possible emission pathway. We select parameter options such that <strong>the</strong>re are 12 750<br />
possible emission pathways of <strong>the</strong> type outlined here. We choose <strong>the</strong> ranges of<br />
<strong>the</strong> parameters to give a range of emission pathways with cumulative emissions<br />
to 2200 between 0.7 <strong>and</strong> 3 TtC. We choose <strong>the</strong> parameters so that <strong>the</strong> majority<br />
of emission pathways have a maximum rate of emissions decline of less than<br />
4 per cent per year, but we also consider a smaller number of pathways that<br />
decrease by up to 10 per cent per year.<br />
We also develop a new set of pathways, extending those described above. These<br />
pathways have ‘emissions floors’ to represent <strong>the</strong> emissions that are <strong>potential</strong>ly<br />
technologically, economically or politically unfeasible to mitigate. Although <strong>the</strong>se<br />
are expressed in terms of CO2 alone, <strong>the</strong>y could also be assumed to include <strong>the</strong><br />
impact of <strong>the</strong> o<strong>the</strong>r principal long-lived anthropogenic radiative <strong>for</strong>cing agent,<br />
N2O. Including <strong>the</strong> impact of fur<strong>the</strong>r non-CO2 <strong>for</strong>cing agents is difficult. Because<br />
Phil. Trans. R. Soc. A (2011)<br />
Downloaded from<br />
rsta.royalsocietypublishing.org on November 30, 2010


