

Four degrees and beyond: the potential for a global ... - Amper
Four degrees and beyond: the potential for a global ... - Amper
Four degrees and beyond: the potential for a global ... - Amper

You also want an ePaper? Increase the reach of your titles
YUMPU automatically turns print PDFs into web optimized ePapers that Google loves.
164 R. J. Nicholls et al.<br />
sea-level rise (m)<br />
2.5<br />
2.0<br />
1.5<br />
1.0<br />
0.5<br />
0<br />
A2. Meehl et al. [5]<br />
A1B. Meehl et al. [5]<br />
Vellinga et al. [31]<br />
A1F1. Meehl et al. [5]<br />
Rahmstorf [28]<br />
Rohling et al. [27]<br />
Pfeffer et al. [22]<br />
Kopp et al. [26]<br />
Vermeer & Rahmstorf [6]<br />
Grinsted et al. [7]<br />
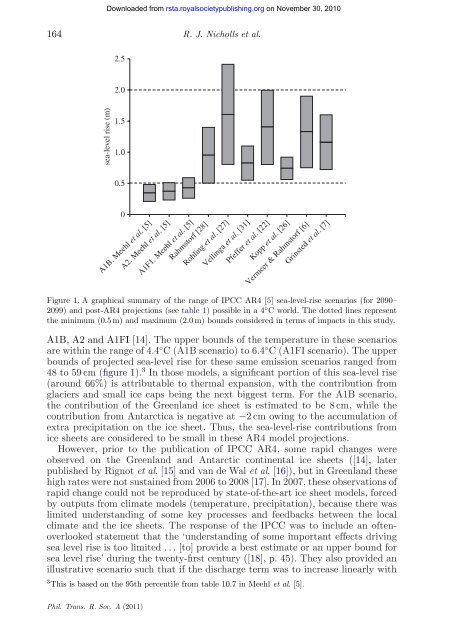
Figure 1. A graphical summary of <strong>the</strong> range of IPCC AR4 [5] sea-level-rise scenarios (<strong>for</strong> 2090–<br />
2099) <strong>and</strong> post-AR4 projections (see table 1) possible in a 4 ◦ C world. The dotted lines represent<br />
<strong>the</strong> minimum (0.5 m) <strong>and</strong> maximum (2.0 m) bounds considered in terms of impacts in this study.<br />
A1B, A2 <strong>and</strong> A1FI [14]. The upper bounds of <strong>the</strong> temperature in <strong>the</strong>se scenarios<br />
are within <strong>the</strong> range of 4.4◦C (A1B scenario) to 6.4◦C (A1FI scenario). The upper<br />
bounds of projected sea-level rise <strong>for</strong> <strong>the</strong>se same emission scenarios ranged from<br />
48 to 59 cm (figure 1). 3 In those models, a significant portion of this sea-level rise<br />
(around 66%) is attributable to <strong>the</strong>rmal expansion, with <strong>the</strong> contribution from<br />
glaciers <strong>and</strong> small ice caps being <strong>the</strong> next biggest term. For <strong>the</strong> A1B scenario,<br />
<strong>the</strong> contribution of <strong>the</strong> Greenl<strong>and</strong> ice sheet is estimated to be 8 cm, while <strong>the</strong><br />
contribution from Antarctica is negative at −2 cm owing to <strong>the</strong> accumulation of<br />
extra precipitation on <strong>the</strong> ice sheet. Thus, <strong>the</strong> sea-level-rise contributions from<br />
ice sheets are considered to be small in <strong>the</strong>se AR4 model projections.<br />
However, prior to <strong>the</strong> publication of IPCC AR4, some rapid changes were<br />
observed on <strong>the</strong> Greenl<strong>and</strong> <strong>and</strong> Antarctic continental ice sheets ([14], later<br />
published by Rignot et al. [15] <strong>and</strong>v<strong>and</strong>eWalet al. [16]), but in Greenl<strong>and</strong> <strong>the</strong>se<br />
high rates were not sustained from 2006 to 2008 [17]. In 2007, <strong>the</strong>se observations of<br />
rapid change could not be reproduced by state-of-<strong>the</strong>-art ice sheet models, <strong>for</strong>ced<br />
by outputs from climate models (temperature, precipitation), because <strong>the</strong>re was<br />
limited underst<strong>and</strong>ing of some key processes <strong>and</strong> feedbacks between <strong>the</strong> local<br />
climate <strong>and</strong> <strong>the</strong> ice sheets. The response of <strong>the</strong> IPCC was to include an oftenoverlooked<br />
statement that <strong>the</strong> ‘underst<strong>and</strong>ing of some important effects driving<br />
sea level rise is too limited ... [to] provide a best estimate or an upper bound <strong>for</strong><br />
sea level rise’ during <strong>the</strong> twenty-first century ([18], p. 45). They also provided an<br />
illustrative scenario such that if <strong>the</strong> discharge term was to increase linearly with<br />
3This is based on <strong>the</strong> 95th percentile from table 10.7 in Meehl et al. [5].<br />
Phil. Trans. R. Soc. A (2011)<br />
Downloaded from<br />
rsta.royalsocietypublishing.org on November 30, 2010


