

Four degrees and beyond: the potential for a global ... - Amper
Four degrees and beyond: the potential for a global ... - Amper
Four degrees and beyond: the potential for a global ... - Amper

You also want an ePaper? Increase the reach of your titles
YUMPU automatically turns print PDFs into web optimized ePapers that Google loves.
emissions (GtC)<br />
Review. Global warming reaching 4 ◦ C 69<br />
40<br />
30<br />
20<br />
10<br />
0<br />
1950<br />
1975 2000 2025<br />
year<br />
2050 2075 2100<br />
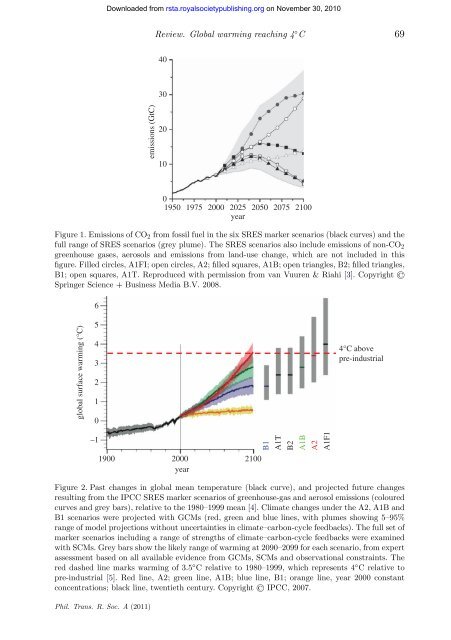
Figure 1. Emissions of CO2 from fossil fuel in <strong>the</strong> six SRES marker scenarios (black curves) <strong>and</strong> <strong>the</strong><br />
full range of SRES scenarios (grey plume). The SRES scenarios also include emissions of non-CO2<br />
greenhouse gases, aerosols <strong>and</strong> emissions from l<strong>and</strong>-use change, which are not included in this<br />
figure. Filled circles, A1FI; open circles, A2; filled squares, A1B; open triangles, B2; filled triangles,<br />
B1; open squares, A1T. Reproduced with permission from van Vuuren & Riahi [3]. Copyright ©<br />
Springer Science + Business Media B.V. 2008.<br />
<strong>global</strong> surface warming (°C)<br />
6<br />
5<br />
4<br />
3<br />
2<br />
1<br />
0<br />
–1<br />
1900<br />
2000 2100<br />
year<br />
B1<br />
A1T<br />
B2<br />
A1B<br />
A2<br />
A1F1<br />
4°C above<br />
pre-industrial<br />
Figure 2. Past changes in <strong>global</strong> mean temperature (black curve), <strong>and</strong> projected future changes<br />
resulting from <strong>the</strong> IPCC SRES marker scenarios of greenhouse-gas <strong>and</strong> aerosol emissions (coloured<br />
curves <strong>and</strong> grey bars), relative to <strong>the</strong> 1980–1999 mean [4]. Climate changes under <strong>the</strong> A2, A1B <strong>and</strong><br />
B1 scenarios were projected with GCMs (red, green <strong>and</strong> blue lines, with plumes showing 5–95%<br />
range of model projections without uncertainties in climate–carbon-cycle feedbacks). The full set of<br />
marker scenarios including a range of strengths of climate–carbon-cycle feedbacks were examined<br />
with SCMs. Grey bars show <strong>the</strong> likely range of warming at 2090–2099 <strong>for</strong> each scenario, from expert<br />
assessment based on all available evidence from GCMs, SCMs <strong>and</strong> observational constraints. The<br />
red dashed line marks warming of 3.5 ◦ C relative to 1980–1999, which represents 4 ◦ C relative to<br />
pre-industrial [5]. Red line, A2; green line, A1B; blue line, B1; orange line, year 2000 constant<br />
concentrations; black line, twentieth century. Copyright © IPCC, 2007.<br />
Phil. Trans. R. Soc. A (2011)<br />
Downloaded from<br />
rsta.royalsocietypublishing.org on November 30, 2010


