

Four degrees and beyond: the potential for a global ... - Amper
Four degrees and beyond: the potential for a global ... - Amper
Four degrees and beyond: the potential for a global ... - Amper

You also want an ePaper? Increase the reach of your titles
YUMPU automatically turns print PDFs into web optimized ePapers that Google loves.
148 P. Zelazowski et al.<br />
(a) 3000<br />
annual precipitation (mm)<br />
(b)<br />
2500<br />
2000<br />
1500<br />
1000<br />
500<br />
0<br />
–1200<br />
South America Africa<br />
south <strong>and</strong> insular Asia<br />
–1000 –800 –600 –400 –200 0 –1200 –1000 –800 –600 –400 –200 0 –1200 –1000 –800 –600 –400 –200 0<br />
MCWD (mm)<br />
100<br />
MCWD (mm)<br />
100<br />
MCWD (mm)<br />
100<br />
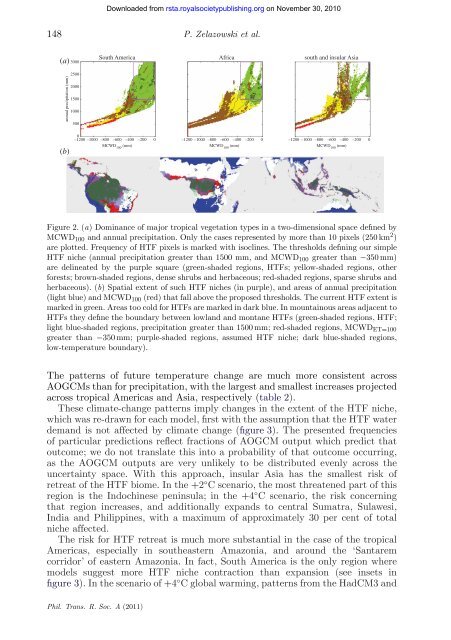
Figure 2. (a) Dominance of major tropical vegetation types in a two-dimensional space defined by<br />
MCWD100 <strong>and</strong> annual precipitation. Only <strong>the</strong> cases represented by more than 10 pixels (250 km 2 )<br />
are plotted. Frequency of HTF pixels is marked with isoclines. The thresholds defining our simple<br />
HTF niche (annual precipitation greater than 1500 mm, <strong>and</strong> MCWD100 greater than −350 mm)<br />
are delineated by <strong>the</strong> purple square (green-shaded regions, HTFs; yellow-shaded regions, o<strong>the</strong>r<br />
<strong>for</strong>ests; brown-shaded regions, dense shrubs <strong>and</strong> herbaceous; red-shaded regions, sparse shrubs <strong>and</strong><br />
herbaceous). (b) Spatial extent of such HTF niches (in purple), <strong>and</strong> areas of annual precipitation<br />
(light blue) <strong>and</strong> MCWD100 (red) that fall above <strong>the</strong> proposed thresholds. The current HTF extent is<br />
marked in green. Areas too cold <strong>for</strong> HTFs are marked in dark blue. In mountainous areas adjacent to<br />
HTFs <strong>the</strong>y define <strong>the</strong> boundary between lowl<strong>and</strong> <strong>and</strong> montane HTFs (green-shaded regions, HTF;<br />
light blue-shaded regions, precipitation greater than 1500 mm; red-shaded regions, MCWDET=100<br />
greater than −350 mm; purple-shaded regions, assumed HTF niche; dark blue-shaded regions,<br />
low-temperature boundary).<br />
The patterns of future temperature change are much more consistent across<br />
AOGCMs than <strong>for</strong> precipitation, with <strong>the</strong> largest <strong>and</strong> smallest increases projected<br />
across tropical Americas <strong>and</strong> Asia, respectively (table 2).<br />
These climate-change patterns imply changes in <strong>the</strong> extent of <strong>the</strong> HTF niche,<br />
which was re-drawn <strong>for</strong> each model, first with <strong>the</strong> assumption that <strong>the</strong> HTF water<br />
dem<strong>and</strong> is not affected by climate change (figure 3). The presented frequencies<br />
of particular predictions reflect fractions of AOGCM output which predict that<br />
outcome; we do not translate this into a probability of that outcome occurring,<br />
as <strong>the</strong> AOGCM outputs are very unlikely to be distributed evenly across <strong>the</strong><br />
uncertainty space. With this approach, insular Asia has <strong>the</strong> smallest risk of<br />
retreat of <strong>the</strong> HTF biome. In <strong>the</strong> +2 ◦ C scenario, <strong>the</strong> most threatened part of this<br />
region is <strong>the</strong> Indochinese peninsula; in <strong>the</strong> +4 ◦ C scenario, <strong>the</strong> risk concerning<br />
that region increases, <strong>and</strong> additionally exp<strong>and</strong>s to central Sumatra, Sulawesi,<br />
India <strong>and</strong> Philippines, with a maximum of approximately 30 per cent of total<br />
niche affected.<br />
The risk <strong>for</strong> HTF retreat is much more substantial in <strong>the</strong> case of <strong>the</strong> tropical<br />
Americas, especially in sou<strong>the</strong>astern Amazonia, <strong>and</strong> around <strong>the</strong> ‘Santarem<br />
corridor’ of eastern Amazonia. In fact, South America is <strong>the</strong> only region where<br />
models suggest more HTF niche contraction than expansion (see insets in<br />
figure 3). In <strong>the</strong> scenario of +4 ◦ C <strong>global</strong> warming, patterns from <strong>the</strong> HadCM3 <strong>and</strong><br />
Phil. Trans. R. Soc. A (2011)<br />
Downloaded from<br />
rsta.royalsocietypublishing.org on November 30, 2010


