

Four degrees and beyond: the potential for a global ... - Amper
Four degrees and beyond: the potential for a global ... - Amper
Four degrees and beyond: the potential for a global ... - Amper

Create successful ePaper yourself
Turn your PDF publications into a flip-book with our unique Google optimized e-Paper software.
78 R. A. Betts et al.<br />
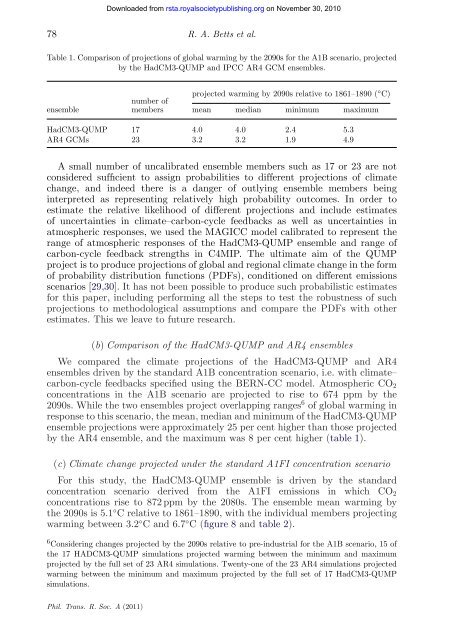
Table 1. Comparison of projections of <strong>global</strong> warming by <strong>the</strong> 2090s <strong>for</strong> <strong>the</strong> A1B scenario, projected<br />
by <strong>the</strong> HadCM3-QUMP <strong>and</strong> IPCC AR4 GCM ensembles.<br />
projected warming by 2090s relative to 1861–1890 ( ◦C) ensemble<br />
number of<br />
members mean median minimum maximum<br />
HadCM3-QUMP 17 4.0 4.0 2.4 5.3<br />
AR4 GCMs 23 3.2 3.2 1.9 4.9<br />
A small number of uncalibrated ensemble members such as 17 or 23 are not<br />
considered sufficient to assign probabilities to different projections of climate<br />
change, <strong>and</strong> indeed <strong>the</strong>re is a danger of outlying ensemble members being<br />
interpreted as representing relatively high probability outcomes. In order to<br />
estimate <strong>the</strong> relative likelihood of different projections <strong>and</strong> include estimates<br />
of uncertainties in climate–carbon-cycle feedbacks as well as uncertainties in<br />
atmospheric responses, we used <strong>the</strong> MAGICC model calibrated to represent <strong>the</strong><br />
range of atmospheric responses of <strong>the</strong> HadCM3-QUMP ensemble <strong>and</strong> range of<br />
carbon-cycle feedback strengths in C4MIP. The ultimate aim of <strong>the</strong> QUMP<br />
project is to produce projections of <strong>global</strong> <strong>and</strong> regional climate change in <strong>the</strong> <strong>for</strong>m<br />
of probability distribution functions (PDFs), conditioned on different emissions<br />
scenarios [29,30]. It has not been possible to produce such probabilistic estimates<br />
<strong>for</strong> this paper, including per<strong>for</strong>ming all <strong>the</strong> steps to test <strong>the</strong> robustness of such<br />
projections to methodological assumptions <strong>and</strong> compare <strong>the</strong> PDFs with o<strong>the</strong>r<br />
estimates. This we leave to future research.<br />
(b) Comparison of <strong>the</strong> HadCM3-QUMP <strong>and</strong> AR4 ensembles<br />
We compared <strong>the</strong> climate projections of <strong>the</strong> HadCM3-QUMP <strong>and</strong> AR4<br />
ensembles driven by <strong>the</strong> st<strong>and</strong>ard A1B concentration scenario, i.e. with climate–<br />
carbon-cycle feedbacks specified using <strong>the</strong> BERN-CC model. Atmospheric CO2<br />
concentrations in <strong>the</strong> A1B scenario are projected to rise to 674 ppm by <strong>the</strong><br />
2090s. While <strong>the</strong> two ensembles project overlapping ranges6 of <strong>global</strong> warming in<br />
response to this scenario, <strong>the</strong> mean, median <strong>and</strong> minimum of <strong>the</strong> HadCM3-QUMP<br />
ensemble projections were approximately 25 per cent higher than those projected<br />
by <strong>the</strong> AR4 ensemble, <strong>and</strong> <strong>the</strong> maximum was 8 per cent higher (table 1).<br />
(c) Climate change projected under <strong>the</strong> st<strong>and</strong>ard A1FI concentration scenario<br />
For this study, <strong>the</strong> HadCM3-QUMP ensemble is driven by <strong>the</strong> st<strong>and</strong>ard<br />
concentration scenario derived from <strong>the</strong> A1FI emissions in which CO2<br />
concentrations rise to 872 ppm by <strong>the</strong> 2080s. The ensemble mean warming by<br />
<strong>the</strong> 2090s is 5.1 ◦ C relative to 1861–1890, with <strong>the</strong> individual members projecting<br />
warming between 3.2 ◦ C <strong>and</strong> 6.7 ◦ C(figure 8 <strong>and</strong> table 2).<br />
6 Considering changes projected by <strong>the</strong> 2090s relative to pre-industrial <strong>for</strong> <strong>the</strong> A1B scenario, 15 of<br />
<strong>the</strong> 17 HADCM3-QUMP simulations projected warming between <strong>the</strong> minimum <strong>and</strong> maximum<br />
projected by <strong>the</strong> full set of 23 AR4 simulations. Twenty-one of <strong>the</strong> 23 AR4 simulations projected<br />
warming between <strong>the</strong> minimum <strong>and</strong> maximum projected by <strong>the</strong> full set of 17 HadCM3-QUMP<br />
simulations.<br />
Phil. Trans. R. Soc. A (2011)<br />
Downloaded from<br />
rsta.royalsocietypublishing.org on November 30, 2010


