

Four degrees and beyond: the potential for a global ... - Amper
Four degrees and beyond: the potential for a global ... - Amper
Four degrees and beyond: the potential for a global ... - Amper

Create successful ePaper yourself
Turn your PDF publications into a flip-book with our unique Google optimized e-Paper software.
(a) 90° N<br />
45° N<br />
0<br />
45° S<br />
90° S<br />
(b) 90° N<br />
45° N<br />
0<br />
45° S<br />
90° S<br />
180°<br />
DJF<br />
JJA<br />
Temperature <strong>and</strong> precipitation change 95<br />
90° W 0 90° E<br />
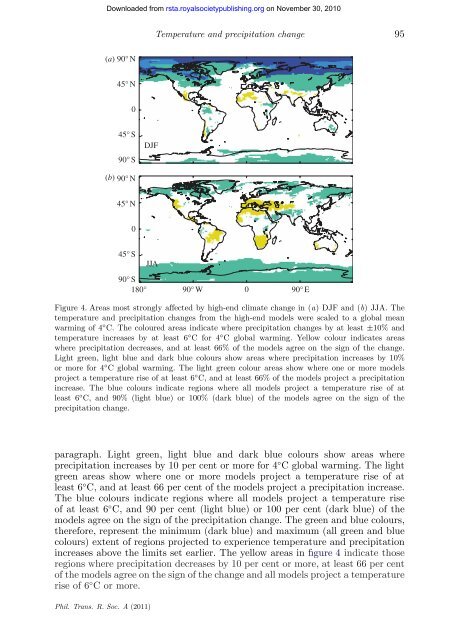
Figure 4. Areas most strongly affected by high-end climate change in (a) DJF <strong>and</strong> (b) JJA. The<br />
temperature <strong>and</strong> precipitation changes from <strong>the</strong> high-end models were scaled to a <strong>global</strong> mean<br />
warming of 4 ◦ C. The coloured areas indicate where precipitation changes by at least ±10% <strong>and</strong><br />
temperature increases by at least 6 ◦ C <strong>for</strong> 4 ◦ C <strong>global</strong> warming. Yellow colour indicates areas<br />
where precipitation decreases, <strong>and</strong> at least 66% of <strong>the</strong> models agree on <strong>the</strong> sign of <strong>the</strong> change.<br />
Light green, light blue <strong>and</strong> dark blue colours show areas where precipitation increases by 10%<br />
or more <strong>for</strong> 4 ◦ C <strong>global</strong> warming. The light green colour areas show where one or more models<br />
project a temperature rise of at least 6 ◦ C, <strong>and</strong> at least 66% of <strong>the</strong> models project a precipitation<br />
increase. The blue colours indicate regions where all models project a temperature rise of at<br />
least 6 ◦ C, <strong>and</strong> 90% (light blue) or 100% (dark blue) of <strong>the</strong> models agree on <strong>the</strong> sign of <strong>the</strong><br />
precipitation change.<br />
paragraph. Light green, light blue <strong>and</strong> dark blue colours show areas where<br />
precipitation increases by 10 per cent or more <strong>for</strong> 4 ◦ C <strong>global</strong> warming. The light<br />
green areas show where one or more models project a temperature rise of at<br />
least 6 ◦ C, <strong>and</strong> at least 66 per cent of <strong>the</strong> models project a precipitation increase.<br />
The blue colours indicate regions where all models project a temperature rise<br />
of at least 6 ◦ C, <strong>and</strong> 90 per cent (light blue) or 100 per cent (dark blue) of <strong>the</strong><br />
models agree on <strong>the</strong> sign of <strong>the</strong> precipitation change. The green <strong>and</strong> blue colours,<br />
<strong>the</strong>re<strong>for</strong>e, represent <strong>the</strong> minimum (dark blue) <strong>and</strong> maximum (all green <strong>and</strong> blue<br />
colours) extent of regions projected to experience temperature <strong>and</strong> precipitation<br />
increases above <strong>the</strong> limits set earlier. The yellow areas in figure 4 indicate those<br />
regions where precipitation decreases by 10 per cent or more, at least 66 per cent<br />
of <strong>the</strong> models agree on <strong>the</strong> sign of <strong>the</strong> change <strong>and</strong> all models project a temperature<br />
rise of 6 ◦ C or more.<br />
Phil. Trans. R. Soc. A (2011)<br />
Downloaded from<br />
rsta.royalsocietypublishing.org on November 30, 2010


