

Four degrees and beyond: the potential for a global ... - Amper
Four degrees and beyond: the potential for a global ... - Amper
Four degrees and beyond: the potential for a global ... - Amper

You also want an ePaper? Increase the reach of your titles
YUMPU automatically turns print PDFs into web optimized ePapers that Google loves.
36 K. Anderson <strong>and</strong> A. Bows<br />
(a) (b)<br />
GtCO 2e yr –1<br />
60<br />
40<br />
20<br />
0<br />
2000 2020 2040 2060<br />
year<br />
2080 2100<br />
2000 2020 2040 2060 2080 2100<br />
year<br />
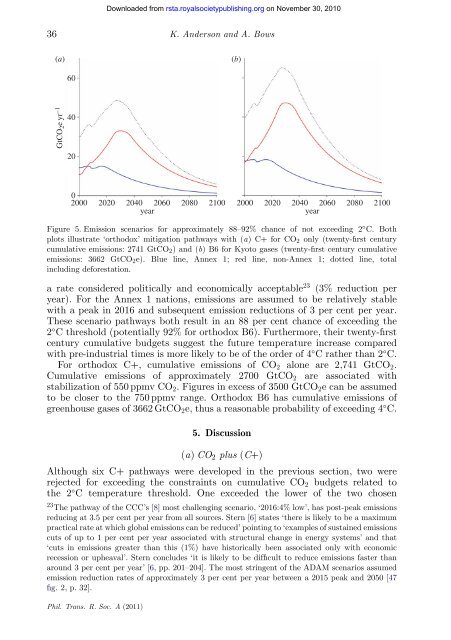
Figure 5. Emission scenarios <strong>for</strong> approximately 88–92% chance of not exceeding 2 ◦ C. Both<br />
plots illustrate ‘orthodox’ mitigation pathways with (a) C+ <strong>for</strong> CO2 only (twenty-first century<br />
cumulative emissions: 2741 GtCO2) <strong>and</strong> (b) B6 <strong>for</strong> Kyoto gases (twenty-first century cumulative<br />
emissions: 3662 GtCO2e). Blue line, Annex 1; red line, non-Annex 1; dotted line, total<br />
including de<strong>for</strong>estation.<br />
a rate considered politically <strong>and</strong> economically acceptable 23 (3% reduction per<br />
year). For <strong>the</strong> Annex 1 nations, emissions are assumed to be relatively stable<br />
with a peak in 2016 <strong>and</strong> subsequent emission reductions of 3 per cent per year.<br />
These scenario pathways both result in an 88 per cent chance of exceeding <strong>the</strong><br />
2 ◦ C threshold (<strong>potential</strong>ly 92% <strong>for</strong> orthodox B6). Fur<strong>the</strong>rmore, <strong>the</strong>ir twenty-first<br />
century cumulative budgets suggest <strong>the</strong> future temperature increase compared<br />
with pre-industrial times is more likely to be of <strong>the</strong> order of 4 ◦ C ra<strong>the</strong>r than 2 ◦ C.<br />
For orthodox C+, cumulative emissions of CO2 alone are 2,741 GtCO2.<br />
Cumulative emissions of approximately 2700 GtCO2 are associated with<br />
stabilization of 550 ppmv CO2. Figures in excess of 3500 GtCO2e can be assumed<br />
to be closer to <strong>the</strong> 750 ppmv range. Orthodox B6 has cumulative emissions of<br />
greenhouse gases of 3662 GtCO2e, thus a reasonable probability of exceeding 4 ◦ C.<br />
5. Discussion<br />
(a) CO2 plus (C+)<br />
Although six C+ pathways were developed in <strong>the</strong> previous section, two were<br />
rejected <strong>for</strong> exceeding <strong>the</strong> constraints on cumulative CO2 budgets related to<br />
<strong>the</strong> 2◦C temperature threshold. One exceeded <strong>the</strong> lower of <strong>the</strong> two chosen<br />
23The pathway of <strong>the</strong> CCC’s [8] most challenging scenario, ‘2016:4% low’, has post-peak emissions<br />
reducing at 3.5 per cent per year from all sources. Stern [6] states ‘<strong>the</strong>re is likely to be a maximum<br />
practical rate at which <strong>global</strong> emissions can be reduced’ pointing to ‘examples of sustained emissions<br />
cuts of up to 1 per cent per year associated with structural change in energy systems’ <strong>and</strong> that<br />
‘cuts in emissions greater than this (1%) have historically been associated only with economic<br />
recession or upheaval’. Stern concludes ‘it is likely to be difficult to reduce emissions faster than<br />
around 3 per cent per year’ [6, pp. 201–204]. The most stringent of <strong>the</strong> ADAM scenarios assumed<br />
emission reduction rates of approximately 3 per cent per year between a 2015 peak <strong>and</strong> 2050 [47<br />
fig. 2, p. 32].<br />
Phil. Trans. R. Soc. A (2011)<br />
Downloaded from<br />
rsta.royalsocietypublishing.org on November 30, 2010


