

Four degrees and beyond: the potential for a global ... - Amper
Four degrees and beyond: the potential for a global ... - Amper
Four degrees and beyond: the potential for a global ... - Amper

Create successful ePaper yourself
Turn your PDF publications into a flip-book with our unique Google optimized e-Paper software.
Beyond dangerous climate change 31<br />
(a) 50<br />
(b) (c)<br />
GtCO 2 yr –1<br />
40<br />
30<br />
20<br />
10<br />
0<br />
2000 2020 2040 2060<br />
year<br />
2080 2100 2000 2020 2040 2060<br />
year<br />
2080 2100 2000 2020 2040 2060<br />
year<br />
2080 2100<br />
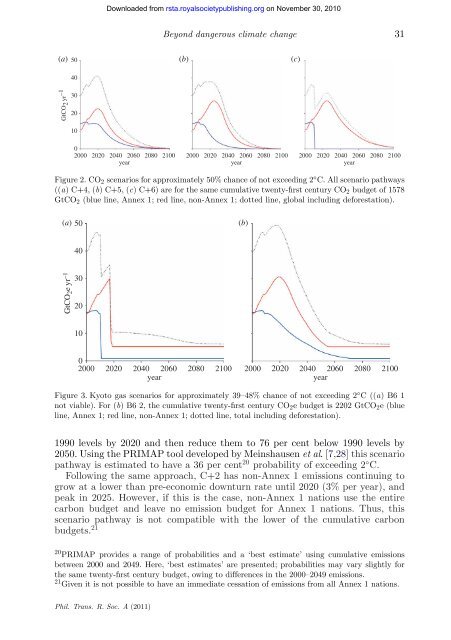
Figure 2. CO2 scenarios <strong>for</strong> approximately 50% chance of not exceeding 2 ◦ C. All scenario pathways<br />
((a) C+4, (b) C+5, (c) C+6) are <strong>for</strong> <strong>the</strong> same cumulative twenty-first century CO2 budget of 1578<br />
GtCO2 (blue line, Annex 1; red line, non-Annex 1; dotted line, <strong>global</strong> including de<strong>for</strong>estation).<br />
(a) 50<br />
(b)<br />
GtCO 2e yr –1<br />
40<br />
30<br />
20<br />
10<br />
0<br />
2000 2020 2040 2060 2080 2100<br />
year<br />
2000 2020 2040 2060 2080 2100<br />
year<br />
Figure 3. Kyoto gas scenarios <strong>for</strong> approximately 39–48% chance of not exceeding 2 ◦ C((a) B61<br />
not viable). For (b) B6 2, <strong>the</strong> cumulative twenty-first century CO2e budget is 2202 GtCO2e (blue<br />
line, Annex 1; red line, non-Annex 1; dotted line, total including de<strong>for</strong>estation).<br />
1990 levels by 2020 <strong>and</strong> <strong>the</strong>n reduce <strong>the</strong>m to 76 per cent below 1990 levels by<br />
2050. Using <strong>the</strong> PRIMAP tool developed by Meinshausen et al.[7,28] this scenario<br />
pathway is estimated to have a 36 per cent 20 probability of exceeding 2 ◦ C.<br />
Following <strong>the</strong> same approach, C+2 has non-Annex 1 emissions continuing to<br />
grow at a lower than pre-economic downturn rate until 2020 (3% per year), <strong>and</strong><br />
peak in 2025. However, if this is <strong>the</strong> case, non-Annex 1 nations use <strong>the</strong> entire<br />
carbon budget <strong>and</strong> leave no emission budget <strong>for</strong> Annex 1 nations. Thus, this<br />
scenario pathway is not compatible with <strong>the</strong> lower of <strong>the</strong> cumulative carbon<br />
budgets. 21<br />
20 PRIMAP provides a range of probabilities <strong>and</strong> a ‘best estimate’ using cumulative emissions<br />
between 2000 <strong>and</strong> 2049. Here, ‘best estimates’ are presented; probabilities may vary slightly <strong>for</strong><br />
<strong>the</strong> same twenty-first century budget, owing to differences in <strong>the</strong> 2000–2049 emissions.<br />
21 Given it is not possible to have an immediate cessation of emissions from all Annex 1 nations.<br />
Phil. Trans. R. Soc. A (2011)<br />
Downloaded from<br />
rsta.royalsocietypublishing.org on November 30, 2010


