

Four degrees and beyond: the potential for a global ... - Amper
Four degrees and beyond: the potential for a global ... - Amper
Four degrees and beyond: the potential for a global ... - Amper

You also want an ePaper? Increase the reach of your titles
YUMPU automatically turns print PDFs into web optimized ePapers that Google loves.
152 P. Zelazowski et al.<br />
(a) (b) 140<br />
2.0<br />
1.5<br />
120<br />
NPP (kg m –2 yr –1 )<br />
1.0<br />
0.5<br />
0<br />
−0.5<br />
1980 2010 2040<br />
year<br />
2070<br />
(c) 140<br />
(d)<br />
ET (mm month –1 )<br />
120<br />
100<br />
80<br />
60<br />
NPP (kg m –2 yr –1 )<br />
100<br />
80<br />
60<br />
2°C 4°C 2°C 4°C<br />
2100<br />
2°C 4°C<br />
400 500 600<br />
CO (ppm)<br />
2<br />
700 800<br />
ET (mm month –1 )<br />
1980 2010 2040<br />
year<br />
2070 2100<br />
2.0<br />
1.5<br />
1.0<br />
0.5<br />
0<br />
−0.5<br />
24 26 28 30 32 34 36 38<br />
temperature (°C)<br />
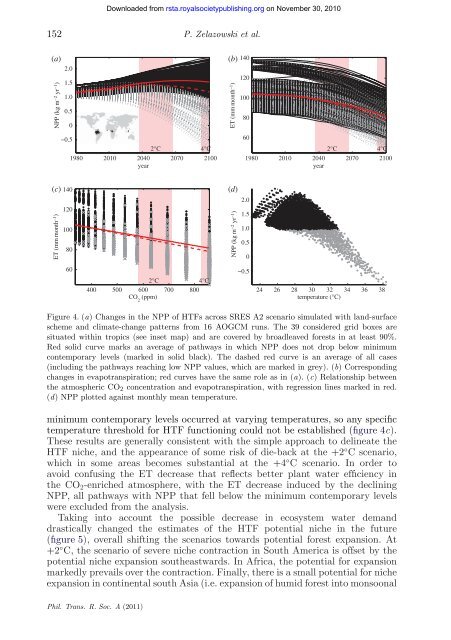
Figure 4. (a) Changes in <strong>the</strong> NPP of HTFs across SRES A2 scenario simulated with l<strong>and</strong>-surface<br />
scheme <strong>and</strong> climate-change patterns from 16 AOGCM runs. The 39 considered grid boxes are<br />
situated within tropics (see inset map) <strong>and</strong> are covered by broadleaved <strong>for</strong>ests in at least 90%.<br />
Red solid curve marks an average of pathways in which NPP does not drop below minimum<br />
contemporary levels (marked in solid black). The dashed red curve is an average of all cases<br />
(including <strong>the</strong> pathways reaching low NPP values, which are marked in grey). (b) Corresponding<br />
changes in evapotranspiration; red curves have <strong>the</strong> same role as in (a). (c) Relationship between<br />
<strong>the</strong> atmospheric CO2 concentration <strong>and</strong> evapotranspiration, with regression lines marked in red.<br />
(d) NPP plotted against monthly mean temperature.<br />
minimum contemporary levels occurred at varying temperatures, so any specific<br />
temperature threshold <strong>for</strong> HTF functioning could not be established (figure 4c).<br />
These results are generally consistent with <strong>the</strong> simple approach to delineate <strong>the</strong><br />
HTF niche, <strong>and</strong> <strong>the</strong> appearance of some risk of die-back at <strong>the</strong> +2 ◦ C scenario,<br />
which in some areas becomes substantial at <strong>the</strong> +4 ◦ C scenario. In order to<br />
avoid confusing <strong>the</strong> ET decrease that reflects better plant water efficiency in<br />
<strong>the</strong> CO2-enriched atmosphere, with <strong>the</strong> ET decrease induced by <strong>the</strong> declining<br />
NPP, all pathways with NPP that fell below <strong>the</strong> minimum contemporary levels<br />
were excluded from <strong>the</strong> analysis.<br />
Taking into account <strong>the</strong> possible decrease in ecosystem water dem<strong>and</strong><br />
drastically changed <strong>the</strong> estimates of <strong>the</strong> HTF <strong>potential</strong> niche in <strong>the</strong> future<br />
(figure 5), overall shifting <strong>the</strong> scenarios towards <strong>potential</strong> <strong>for</strong>est expansion. At<br />
+2 ◦ C, <strong>the</strong> scenario of severe niche contraction in South America is offset by <strong>the</strong><br />
<strong>potential</strong> niche expansion sou<strong>the</strong>astwards. In Africa, <strong>the</strong> <strong>potential</strong> <strong>for</strong> expansion<br />
markedly prevails over <strong>the</strong> contraction. Finally, <strong>the</strong>re is a small <strong>potential</strong> <strong>for</strong> niche<br />
expansion in continental south Asia (i.e. expansion of humid <strong>for</strong>est into monsoonal<br />
Phil. Trans. R. Soc. A (2011)<br />
Downloaded from<br />
rsta.royalsocietypublishing.org on November 30, 2010


