

Four degrees and beyond: the potential for a global ... - Amper
Four degrees and beyond: the potential for a global ... - Amper
Four degrees and beyond: the potential for a global ... - Amper

Create successful ePaper yourself
Turn your PDF publications into a flip-book with our unique Google optimized e-Paper software.
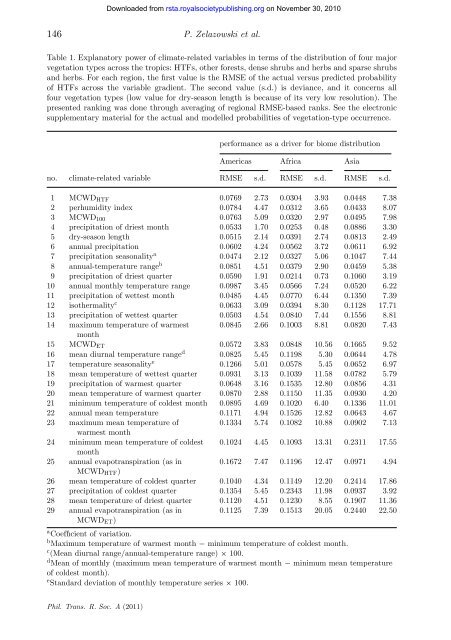
146 P. Zelazowski et al.<br />
Table 1. Explanatory power of climate-related variables in terms of <strong>the</strong> distribution of four major<br />
vegetation types across <strong>the</strong> tropics: HTFs, o<strong>the</strong>r <strong>for</strong>ests, dense shrubs <strong>and</strong> herbs <strong>and</strong> sparse shrubs<br />
<strong>and</strong> herbs. For each region, <strong>the</strong> first value is <strong>the</strong> RMSE of <strong>the</strong> actual versus predicted probability<br />
of HTFs across <strong>the</strong> variable gradient. The second value (s.d.) is deviance, <strong>and</strong> it concerns all<br />
four vegetation types (low value <strong>for</strong> dry-season length is because of its very low resolution). The<br />
presented ranking was done through averaging of regional RMSE-based ranks. See <strong>the</strong> electronic<br />
supplementary material <strong>for</strong> <strong>the</strong> actual <strong>and</strong> modelled probabilities of vegetation-type occurrence.<br />
per<strong>for</strong>mance as a driver <strong>for</strong> biome distribution<br />
Americas Africa Asia<br />
no. climate-related variable RMSE s.d. RMSE s.d. RMSE s.d.<br />
1 MCWDHTF 0.0769 2.73 0.0304 3.93 0.0448 7.38<br />
2 perhumidity index 0.0784 4.47 0.0312 3.65 0.0433 8.07<br />
3 MCWD100 0.0763 5.09 0.0320 2.97 0.0495 7.98<br />
4 precipitation of driest month 0.0533 1.70 0.0253 0.48 0.0886 3.30<br />
5 dry-season length 0.0515 2.14 0.0391 2.74 0.0813 2.49<br />
6 annual precipitation 0.0602 4.24 0.0562 3.72 0.0611 6.92<br />
7 precipitation seasonalitya 0.0474 2.12 0.0327 5.06 0.1047 7.44<br />
8 annual-temperature rangeb 0.0851 4.51 0.0379 2.90 0.0459 5.38<br />
9 precipitation of driest quarter 0.0590 1.91 0.0214 0.73 0.1060 3.19<br />
10 annual monthly temperature range 0.0987 3.45 0.0566 7.24 0.0520 6.22<br />
11 precipitation of wettest month 0.0485 4.45 0.0770 6.44 0.1350 7.39<br />
12 iso<strong>the</strong>rmalityc 0.0633 3.09 0.0394 8.30 0.1128 17.71<br />
13 precipitation of wettest quarter 0.0503 4.54 0.0840 7.44 0.1556 8.81<br />
14 maximum temperature of warmest<br />
month<br />
0.0845 2.66 0.1003 8.81 0.0820 7.43<br />
15<br />
16<br />
MCWDET<br />
mean diurnal temperature range<br />
0.0572 3.83 0.0848 10.56 0.1665 9.52<br />
d 0.0825 5.45 0.1198 5.30 0.0644 4.78<br />
17 temperature seasonalitye 0.1266 5.01 0.0578 5.45 0.0652 6.97<br />
18 mean temperature of wettest quarter 0.0931 3.13 0.1039 11.58 0.0782 5.79<br />
19 precipitation of warmest quarter 0.0648 3.16 0.1535 12.80 0.0856 4.31<br />
20 mean temperature of warmest quarter 0.0870 2.88 0.1150 11.35 0.0930 4.20<br />
21 minimum temperature of coldest month 0.0895 4.69 0.1020 6.40 0.1336 11.01<br />
22 annual mean temperature 0.1171 4.94 0.1526 12.82 0.0643 4.67<br />
23 maximum mean temperature of<br />
warmest month<br />
0.1334 5.74 0.1082 10.88 0.0902 7.13<br />
24 minimum mean temperature of coldest<br />
month<br />
0.1024 4.45 0.1093 13.31 0.2311 17.55<br />
25 annual evapotranspiration (as in<br />
MCWDHTF)<br />
0.1672 7.47 0.1196 12.47 0.0971 4.94<br />
26 mean temperature of coldest quarter 0.1040 4.34 0.1149 12.20 0.2414 17.86<br />
27 precipitation of coldest quarter 0.1354 5.45 0.2343 11.98 0.0937 3.92<br />
28 mean temperature of driest quarter 0.1120 4.51 0.1230 8.55 0.1907 11.36<br />
29 annual evapotranspiration (as in<br />
MCWDET)<br />
0.1125 7.39 0.1513 20.05 0.2440 22.50<br />
aCoefficient of variation.<br />
bMaximum temperature of warmest month − minimum temperature of coldest month.<br />
c (Mean diurnal range/annual-temperature range) × 100.<br />
dMean of monthly (maximum mean temperature of warmest month − minimum mean temperature<br />
of coldest month).<br />
eSt<strong>and</strong>ard deviation of monthly temperature series × 100.<br />
Phil. Trans. R. Soc. A (2011)<br />
Downloaded from<br />
rsta.royalsocietypublishing.org on November 30, 2010


