

Four degrees and beyond: the potential for a global ... - Amper
Four degrees and beyond: the potential for a global ... - Amper
Four degrees and beyond: the potential for a global ... - Amper

You also want an ePaper? Increase the reach of your titles
YUMPU automatically turns print PDFs into web optimized ePapers that Google loves.
(a)<br />
Humid tropical <strong>for</strong>ests on a warmer planet 141<br />
(b) (c)<br />
MCWD 100<br />
0<br />
mm<br />
–1200<br />
(d) annual precipitation<br />
(e)<br />
>4000<br />
(f) dry-season length<br />
(g)<br />
mm<br />
0<br />
0<br />
months<br />
12<br />
MCWD HTF<br />
annual-temperature range<br />
perhumidity index<br />
flooded <strong>for</strong>est (freshwater)<br />
broadleaved evergreen <strong>for</strong>est<br />
broadleaved deciduous closed <strong>for</strong>est<br />
broadleaved deciduous open <strong>for</strong>est<br />
shrub<br />
herbaceous<br />
herbaceous/shrub sparse<br />
bare<br />
outside temperature niche<br />
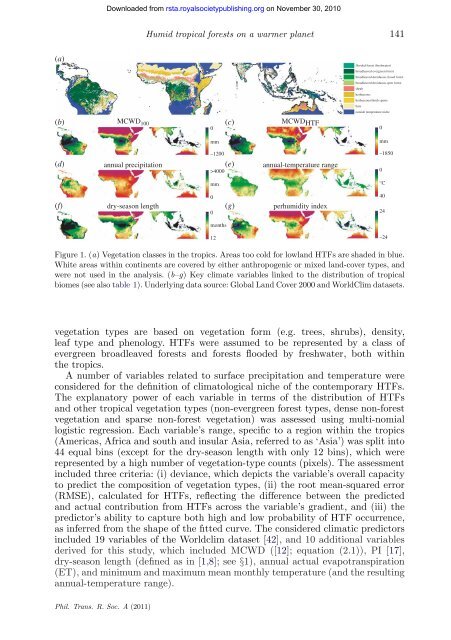
Figure 1. (a) Vegetation classes in <strong>the</strong> tropics. Areas too cold <strong>for</strong> lowl<strong>and</strong> HTFs are shaded in blue.<br />
White areas within continents are covered by ei<strong>the</strong>r anthropogenic or mixed l<strong>and</strong>-cover types, <strong>and</strong><br />
were not used in <strong>the</strong> analysis. (b–g) Key climate variables linked to <strong>the</strong> distribution of tropical<br />
biomes (see also table 1). Underlying data source: Global L<strong>and</strong> Cover 2000 <strong>and</strong> WorldClim datasets.<br />
vegetation types are based on vegetation <strong>for</strong>m (e.g. trees, shrubs), density,<br />
leaf type <strong>and</strong> phenology. HTFs were assumed to be represented by a class of<br />
evergreen broadleaved <strong>for</strong>ests <strong>and</strong> <strong>for</strong>ests flooded by freshwater, both within<br />
<strong>the</strong> tropics.<br />
A number of variables related to surface precipitation <strong>and</strong> temperature were<br />
considered <strong>for</strong> <strong>the</strong> definition of climatological niche of <strong>the</strong> contemporary HTFs.<br />
The explanatory power of each variable in terms of <strong>the</strong> distribution of HTFs<br />
<strong>and</strong> o<strong>the</strong>r tropical vegetation types (non-evergreen <strong>for</strong>est types, dense non-<strong>for</strong>est<br />
vegetation <strong>and</strong> sparse non-<strong>for</strong>est vegetation) was assessed using multi-nomial<br />
logistic regression. Each variable’s range, specific to a region within <strong>the</strong> tropics<br />
(Americas, Africa <strong>and</strong> south <strong>and</strong> insular Asia, referred to as ‘Asia’) was split into<br />
44 equal bins (except <strong>for</strong> <strong>the</strong> dry-season length with only 12 bins), which were<br />
represented by a high number of vegetation-type counts (pixels). The assessment<br />
included three criteria: (i) deviance, which depicts <strong>the</strong> variable’s overall capacity<br />
to predict <strong>the</strong> composition of vegetation types, (ii) <strong>the</strong> root mean-squared error<br />
(RMSE), calculated <strong>for</strong> HTFs, reflecting <strong>the</strong> difference between <strong>the</strong> predicted<br />
<strong>and</strong> actual contribution from HTFs across <strong>the</strong> variable’s gradient, <strong>and</strong> (iii) <strong>the</strong><br />
predictor’s ability to capture both high <strong>and</strong> low probability of HTF occurrence,<br />
as inferred from <strong>the</strong> shape of <strong>the</strong> fitted curve. The considered climatic predictors<br />
included 19 variables of <strong>the</strong> Worldclim dataset [42], <strong>and</strong> 10 additional variables<br />
derived <strong>for</strong> this study, which included MCWD ([12]; equation (2.1)), PI [17],<br />
dry-season length (defined as in [1,8]; see §1), annual actual evapotranspiration<br />
(ET), <strong>and</strong> minimum <strong>and</strong> maximum mean monthly temperature (<strong>and</strong> <strong>the</strong> resulting<br />
annual-temperature range).<br />
Phil. Trans. R. Soc. A (2011)<br />
Downloaded from<br />
rsta.royalsocietypublishing.org on November 30, 2010<br />
0<br />
mm<br />
–1850<br />
0<br />
°C<br />
40<br />
24<br />
–24


