

Four degrees and beyond: the potential for a global ... - Amper
Four degrees and beyond: the potential for a global ... - Amper
Four degrees and beyond: the potential for a global ... - Amper

You also want an ePaper? Increase the reach of your titles
YUMPU automatically turns print PDFs into web optimized ePapers that Google loves.
72 R. A. Betts et al.<br />
billions of tons of carbon<br />
13<br />
12<br />
11<br />
10<br />
9<br />
8<br />
7<br />
6<br />
1990<br />
1992<br />
1994<br />
1996<br />
1998<br />
2000<br />
2002<br />
2004<br />
2006<br />
2008<br />
year<br />
2010<br />
2012<br />
2014<br />
2016<br />
2018<br />
2020<br />
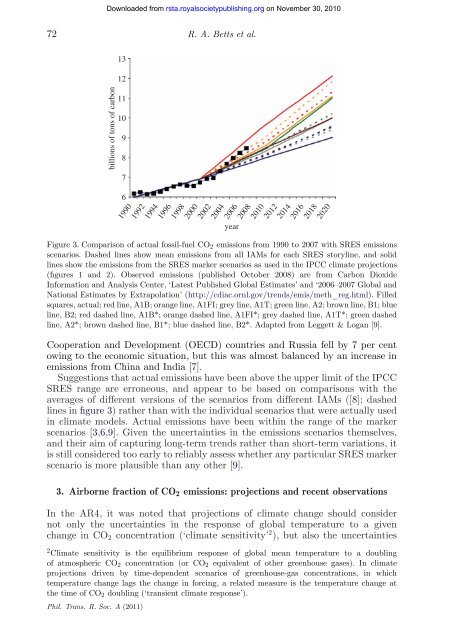
Figure 3. Comparison of actual fossil-fuel CO2 emissions from 1990 to 2007 with SRES emissions<br />
scenarios. Dashed lines show mean emissions from all IAMs <strong>for</strong> each SRES storyline, <strong>and</strong> solid<br />
lines show <strong>the</strong> emissions from <strong>the</strong> SRES marker scenarios as used in <strong>the</strong> IPCC climate projections<br />
(figures 1 <strong>and</strong> 2). Observed emissions (published October 2008) are from Carbon Dioxide<br />
In<strong>for</strong>mation <strong>and</strong> Analysis Center, ‘Latest Published Global Estimates’ <strong>and</strong> ‘2006–2007 Global <strong>and</strong><br />
National Estimates by Extrapolation’ (http://cdiac.ornl.gov/trends/emis/meth_reg.html). Filled<br />
squares, actual; red line, A1B; orange line, A1FI; grey line, A1T; green line, A2; brown line, B1; blue<br />
line, B2; red dashed line, A1B*; orange dashed line, A1FI*; grey dashed line, A1T*; green dashed<br />
line, A2*; brown dashed line, B1*; blue dashed line, B2*. Adapted from Leggett & Logan [9].<br />
Cooperation <strong>and</strong> Development (OECD) countries <strong>and</strong> Russia fell by 7 per cent<br />
owing to <strong>the</strong> economic situation, but this was almost balanced by an increase in<br />
emissions from China <strong>and</strong> India [7].<br />
Suggestions that actual emissions have been above <strong>the</strong> upper limit of <strong>the</strong> IPCC<br />
SRES range are erroneous, <strong>and</strong> appear to be based on comparisons with <strong>the</strong><br />
averages of different versions of <strong>the</strong> scenarios from different IAMs ([8]; dashed<br />
lines in figure 3) ra<strong>the</strong>r than with <strong>the</strong> individual scenarios that were actually used<br />
in climate models. Actual emissions have been within <strong>the</strong> range of <strong>the</strong> marker<br />
scenarios [3,6,9]. Given <strong>the</strong> uncertainties in <strong>the</strong> emissions scenarios <strong>the</strong>mselves,<br />
<strong>and</strong> <strong>the</strong>ir aim of capturing long-term trends ra<strong>the</strong>r than short-term variations, it<br />
is still considered too early to reliably assess whe<strong>the</strong>r any particular SRES marker<br />
scenario is more plausible than any o<strong>the</strong>r [9].<br />
3. Airborne fraction of CO2 emissions: projections <strong>and</strong> recent observations<br />
In <strong>the</strong> AR4, it was noted that projections of climate change should consider<br />
not only <strong>the</strong> uncertainties in <strong>the</strong> response of <strong>global</strong> temperature to a given<br />
change in CO2 concentration (‘climate sensitivity’ 2 ), but also <strong>the</strong> uncertainties<br />
2 Climate sensitivity is <strong>the</strong> equilibrium response of <strong>global</strong> mean temperature to a doubling<br />
of atmospheric CO2 concentration (or CO2 equivalent of o<strong>the</strong>r greenhouse gases). In climate<br />
projections driven by time-dependent scenarios of greenhouse-gas concentrations, in which<br />
temperature change lags <strong>the</strong> change in <strong>for</strong>cing, a related measure is <strong>the</strong> temperature change at<br />
<strong>the</strong> time of CO2 doubling (‘transient climate response’).<br />
Phil. Trans. R. Soc. A (2011)<br />
Downloaded from<br />
rsta.royalsocietypublishing.org on November 30, 2010


