

Four degrees and beyond: the potential for a global ... - Amper
Four degrees and beyond: the potential for a global ... - Amper
Four degrees and beyond: the potential for a global ... - Amper

Create successful ePaper yourself
Turn your PDF publications into a flip-book with our unique Google optimized e-Paper software.
(a) (b)<br />
African agriculture in a 4 ◦ C+ world 121<br />
>20% loss<br />
5–20% loss<br />
no change<br />
5–20% gain<br />
>20% gain<br />
50<br />
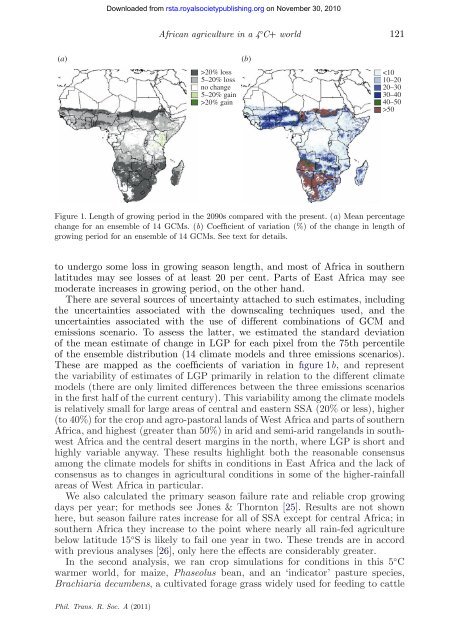
Figure 1. Length of growing period in <strong>the</strong> 2090s compared with <strong>the</strong> present. (a) Mean percentage<br />
change <strong>for</strong> an ensemble of 14 GCMs. (b) Coefficient of variation (%) of <strong>the</strong> change in length of<br />
growing period <strong>for</strong> an ensemble of 14 GCMs. See text <strong>for</strong> details.<br />
to undergo some loss in growing season length, <strong>and</strong> most of Africa in sou<strong>the</strong>rn<br />
latitudes may see losses of at least 20 per cent. Parts of East Africa may see<br />
moderate increases in growing period, on <strong>the</strong> o<strong>the</strong>r h<strong>and</strong>.<br />
There are several sources of uncertainty attached to such estimates, including<br />
<strong>the</strong> uncertainties associated with <strong>the</strong> downscaling techniques used, <strong>and</strong> <strong>the</strong><br />
uncertainties associated with <strong>the</strong> use of different combinations of GCM <strong>and</strong><br />
emissions scenario. To assess <strong>the</strong> latter, we estimated <strong>the</strong> st<strong>and</strong>ard deviation<br />
of <strong>the</strong> mean estimate of change in LGP <strong>for</strong> each pixel from <strong>the</strong> 75th percentile<br />
of <strong>the</strong> ensemble distribution (14 climate models <strong>and</strong> three emissions scenarios).<br />
These are mapped as <strong>the</strong> coefficients of variation in figure 1b, <strong>and</strong> represent<br />
<strong>the</strong> variability of estimates of LGP primarily in relation to <strong>the</strong> different climate<br />
models (<strong>the</strong>re are only limited differences between <strong>the</strong> three emissions scenarios<br />
in <strong>the</strong> first half of <strong>the</strong> current century). This variability among <strong>the</strong> climate models<br />
is relatively small <strong>for</strong> large areas of central <strong>and</strong> eastern SSA (20% or less), higher<br />
(to 40%) <strong>for</strong> <strong>the</strong> crop <strong>and</strong> agro-pastoral l<strong>and</strong>s of West Africa <strong>and</strong> parts of sou<strong>the</strong>rn<br />
Africa, <strong>and</strong> highest (greater than 50%) in arid <strong>and</strong> semi-arid rangel<strong>and</strong>s in southwest<br />
Africa <strong>and</strong> <strong>the</strong> central desert margins in <strong>the</strong> north, where LGP is short <strong>and</strong><br />
highly variable anyway. These results highlight both <strong>the</strong> reasonable consensus<br />
among <strong>the</strong> climate models <strong>for</strong> shifts in conditions in East Africa <strong>and</strong> <strong>the</strong> lack of<br />
consensus as to changes in agricultural conditions in some of <strong>the</strong> higher-rainfall<br />
areas of West Africa in particular.<br />
We also calculated <strong>the</strong> primary season failure rate <strong>and</strong> reliable crop growing<br />
days per year; <strong>for</strong> methods see Jones & Thornton [25]. Results are not shown<br />
here, but season failure rates increase <strong>for</strong> all of SSA except <strong>for</strong> central Africa; in<br />
sou<strong>the</strong>rn Africa <strong>the</strong>y increase to <strong>the</strong> point where nearly all rain-fed agriculture<br />
below latitude 15 ◦ S is likely to fail one year in two. These trends are in accord<br />
with previous analyses [26], only here <strong>the</strong> effects are considerably greater.<br />
In <strong>the</strong> second analysis, we ran crop simulations <strong>for</strong> conditions in this 5 ◦ C<br />
warmer world, <strong>for</strong> maize, Phaseolus bean, <strong>and</strong> an ‘indicator’ pasture species,<br />
Brachiaria decumbens, a cultivated <strong>for</strong>age grass widely used <strong>for</strong> feeding to cattle<br />
Phil. Trans. R. Soc. A (2011)<br />
Downloaded from<br />
rsta.royalsocietypublishing.org on November 30, 2010


