

Four degrees and beyond: the potential for a global ... - Amper
Four degrees and beyond: the potential for a global ... - Amper
Four degrees and beyond: the potential for a global ... - Amper

You also want an ePaper? Increase the reach of your titles
YUMPU automatically turns print PDFs into web optimized ePapers that Google loves.
(a) 50<br />
(b)<br />
GtCO 2e yr –1<br />
40<br />
30<br />
20<br />
10<br />
0<br />
2000 2020 2040 2060 2080 2100<br />
year<br />
Beyond dangerous climate change 33<br />
2000 2020 2040 2060 2080 2100<br />
year<br />
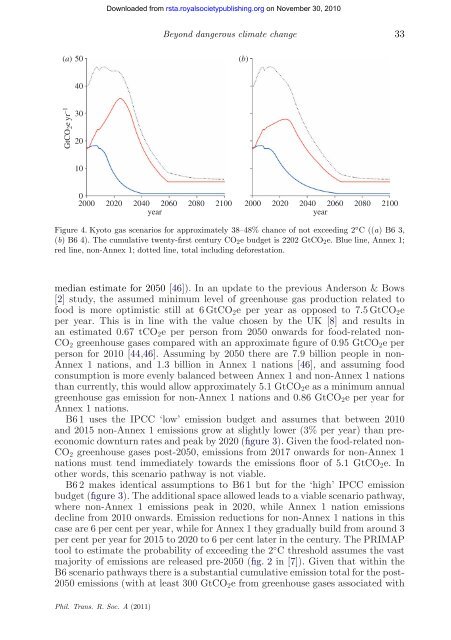
Figure 4. Kyoto gas scenarios <strong>for</strong> approximately 38–48% chance of not exceeding 2 ◦ C((a) B63,<br />
(b) B6 4). The cumulative twenty-first century CO2e budget is 2202 GtCO2e. Blue line, Annex 1;<br />
red line, non-Annex 1; dotted line, total including de<strong>for</strong>estation.<br />
median estimate <strong>for</strong> 2050 [46]). In an update to <strong>the</strong> previous Anderson & Bows<br />
[2] study, <strong>the</strong> assumed minimum level of greenhouse gas production related to<br />
food is more optimistic still at 6 GtCO2e per year as opposed to 7.5 GtCO2e<br />
per year. This is in line with <strong>the</strong> value chosen by <strong>the</strong> UK [8] <strong>and</strong> results in<br />
an estimated 0.67 tCO2e per person from 2050 onwards <strong>for</strong> food-related non-<br />
CO2 greenhouse gases compared with an approximate figure of 0.95 GtCO2e per<br />
person <strong>for</strong> 2010 [44,46]. Assuming by 2050 <strong>the</strong>re are 7.9 billion people in non-<br />
Annex 1 nations, <strong>and</strong> 1.3 billion in Annex 1 nations [46], <strong>and</strong> assuming food<br />
consumption is more evenly balanced between Annex 1 <strong>and</strong> non-Annex 1 nations<br />
than currently, this would allow approximately 5.1 GtCO2e as a minimum annual<br />
greenhouse gas emission <strong>for</strong> non-Annex 1 nations <strong>and</strong> 0.86 GtCO2e per year <strong>for</strong><br />
Annex 1 nations.<br />
B6 1 uses <strong>the</strong> IPCC ‘low’ emission budget <strong>and</strong> assumes that between 2010<br />
<strong>and</strong> 2015 non-Annex 1 emissions grow at slightly lower (3% per year) than preeconomic<br />
downturn rates <strong>and</strong> peak by 2020 (figure 3). Given <strong>the</strong> food-related non-<br />
CO2 greenhouse gases post-2050, emissions from 2017 onwards <strong>for</strong> non-Annex 1<br />
nations must tend immediately towards <strong>the</strong> emissions floor of 5.1 GtCO2e. In<br />
o<strong>the</strong>r words, this scenario pathway is not viable.<br />
B6 2 makes identical assumptions to B6 1 but <strong>for</strong> <strong>the</strong> ‘high’ IPCC emission<br />
budget (figure 3). The additional space allowed leads to a viable scenario pathway,<br />
where non-Annex 1 emissions peak in 2020, while Annex 1 nation emissions<br />
decline from 2010 onwards. Emission reductions <strong>for</strong> non-Annex 1 nations in this<br />
case are 6 per cent per year, while <strong>for</strong> Annex 1 <strong>the</strong>y gradually build from around 3<br />
per cent per year <strong>for</strong> 2015 to 2020 to 6 per cent later in <strong>the</strong> century. The PRIMAP<br />
tool to estimate <strong>the</strong> probability of exceeding <strong>the</strong> 2 ◦ C threshold assumes <strong>the</strong> vast<br />
majority of emissions are released pre-2050 (fig. 2 in [7]). Given that within <strong>the</strong><br />
B6 scenario pathways <strong>the</strong>re is a substantial cumulative emission total <strong>for</strong> <strong>the</strong> post-<br />
2050 emissions (with at least 300 GtCO2e from greenhouse gases associated with<br />
Phil. Trans. R. Soc. A (2011)<br />
Downloaded from<br />
rsta.royalsocietypublishing.org on November 30, 2010


