Document de référence 2012 - ESI Group
Document de référence 2012 - ESI Group
Document de référence 2012 - ESI Group

You also want an ePaper? Increase the reach of your titles
YUMPU automatically turns print PDFs into web optimized ePapers that Google loves.
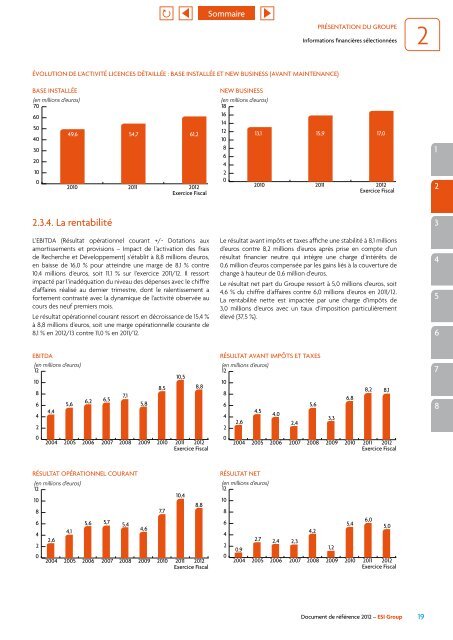
ÉVOLUTION DE L’ACTIVITÉ LICENCES DÉTAILLÉE : BASE INSTALLÉE ET NEw BUSINESS (AVANT MAINTENANCE)<br />
BASE INSTALLÉE<br />
(en millions d’euros)<br />
70<br />
60<br />
50<br />
40<br />
30<br />
20<br />
10<br />
0<br />
49,6<br />
54,7<br />
61,2<br />
2010 2011 <strong>2012</strong><br />
Exercice Fiscal<br />
2.3.4. La rentabilité<br />
L’eBitda (résultat opérationnel courant +/- dotations aux<br />
amortissements et provisions – impact <strong>de</strong> l’activation <strong>de</strong>s frais<br />
<strong>de</strong> Recherche et Développement) s’établit à 8,8 millions d’euros,<br />
en baisse <strong>de</strong> 16,0 % pour atteindre une marge <strong>de</strong> 8,1 % contre<br />
10,4 millions d’euros, soit 11,1 % sur l’exercice 2011/12. Il ressort<br />
impacté par l’inadéquation du niveau <strong>de</strong>s dépenses avec le chiffre<br />
d’affaires réalisé au <strong>de</strong>rnier trimestre, dont le ralentissement a<br />
fortement contrasté avec la dynamique <strong>de</strong> l’activité observée au<br />
cours <strong>de</strong>s neuf premiers mois.<br />
Le résultat opérationnel courant ressort en décroissance <strong>de</strong> 15,4 %<br />
à 8,8 millions d’euros, soit une marge opérationnelle courante <strong>de</strong><br />
8,1 % en <strong>2012</strong>/13 contre 11,0 % en 2011/12.<br />
EBITDA<br />
(en millions d’euros)<br />
12<br />
10<br />
8<br />
6<br />
4<br />
2<br />
0<br />
4,4<br />
5,6<br />
6,2<br />
6,5<br />
7,1<br />
10,5<br />
2004 2005 2006 2007 2008 2009 2010 2011 <strong>2012</strong><br />
Exercice Fiscal<br />
RÉSULTAT OPÉRATIONNEL COURANT<br />
(en millions d’euros)<br />
12<br />
10<br />
8<br />
6<br />
4<br />
2<br />
0<br />
2,6<br />
4,1<br />
5,6<br />
5,7<br />
5,4<br />
2004 2005 2006 2007 2008 2009 2010 2011 <strong>2012</strong><br />
Exercice Fiscal<br />
5,8<br />
4,6<br />
8,5<br />
7,7<br />
10,4<br />
8,8<br />
8,8<br />
NEw BUSINESS<br />
PRÉSENTATION DU GROUPE<br />
2<br />
Informations financières sélectionnées<br />
(en millions d’euros)<br />
18<br />
16<br />
14<br />
12<br />
10<br />
8<br />
6<br />
4<br />
2<br />
13,1<br />
15,9<br />
17,0<br />
0<br />
2010 2011 <strong>2012</strong><br />
Exercice Fiscal<br />
Le résultat avant impôts et taxes affiche une stabilité à 8,1 millions<br />
d’euros contre 8,2 millions d’euros après prise en compte d’un<br />
résultat financier neutre qui intègre une charge d’intérêts <strong>de</strong><br />
0,6 million d’euros compensée par les gains liés à la couverture <strong>de</strong><br />
change à hauteur <strong>de</strong> 0,6 million d’euros.<br />
Le résultat net part du <strong>Group</strong>e ressort à 5,0 millions d’euros, soit<br />
4,6 % du chiffre d’affaires contre 6,0 millions d’euros en 2011/12.<br />
La rentabilité nette est impactée par une charge d’impôts <strong>de</strong><br />
3,0 millions d’euros avec un taux d’imposition particulièrement<br />
élevé (37,5 %).<br />
RÉSULTAT AVANT IMPôTS ET TAxES<br />
(en millions d’euros)<br />
12<br />
10<br />
8<br />
6<br />
4<br />
2<br />
0<br />
2,6<br />
4,5<br />
4,0<br />
2,4<br />
5,6<br />
8,2 8,1<br />
2004 2005 2006 2007 2008 2009 2010 2011 <strong>2012</strong><br />
Exercice Fiscal<br />
RÉSULTAT NET<br />
(en millions d’euros)<br />
12<br />
10<br />
8<br />
6<br />
4<br />
2<br />
0<br />
0,9<br />
2,7 2,4 2,3<br />
4,2<br />
2004 2005 2006 2007 2008 2009 2010 2011 <strong>2012</strong><br />
Exercice Fiscal<br />
3,3<br />
1,2<br />
6,8<br />
5,4<br />
6,0<br />
5,0<br />
<strong>Document</strong> <strong>de</strong> <strong>référence</strong> <strong>2012</strong> – <strong>ESI</strong> <strong>Group</strong><br />
19