- Page 3 and 4:
MATEMÁTICA 3
- Page 5:
Este livro foi realizado com a inte
- Page 9 and 10:
MATEMÁTICA BÁSICA I - NÚMEROS PR
- Page 11 and 12:
EXERCÍCIOS DE SALA: 3. Se x, y e z
- Page 13 and 14:
7. (UEFS) O vencedor de uma prova d
- Page 15 and 16:
2. Do dinheiro que possuía, João
- Page 17 and 18:
3. (UFOP MG/2009/Julho). O valor si
- Page 19 and 20:
3. (IBMEC) A diferença entre o qua
- Page 21 and 22:
5. (Unesp) Por hipótese, considere
- Page 23 and 24:
4. (Puc-rio) O produto (x+1)(x 2 -
- Page 25 and 26:
7. (UFC CE/2009/Janeiro) O expoente
- Page 27 and 28:
VI. 3 Potência de um Produto A pot
- Page 29 and 30:
EXERCÍCIOS PRPOSTOS: 1. (UESC) Con
- Page 31 and 32:
9. Simplificando-se a expressão 9
- Page 33 and 34:
EXERCÍCIOS DE SALA: 33 2 1. (UFPE/
- Page 35 and 36:
2. (CFTMG/2010) Considerando as seg
- Page 37 and 38:
EXERCÍCIOS PROPOSTOS: 1. (FUVEST)
- Page 39 and 40:
5 3 8. (CFTMG 2011) Se m e 1 1 1
- Page 41 and 42:
2. (CESGRANRIO)O produto das raíze
- Page 43 and 44:
5. (UEFS-09.1) Na divisão das desp
- Page 45 and 46:
11. Marcela precisava ler um livro
- Page 47 and 48:
CONJUNTO 1. INTRODUÇÃO: Como o pr
- Page 49 and 50:
6. OPERAÇÕES ENTRE CONJUNTOS: 6.1
- Page 51 and 52:
EXERCÍCIOS DE SALA: 1. Dados A = {
- Page 53 and 54:
7. CONJUNTOS NUMÉRICOS: É todo co
- Page 55 and 56:
2. (CONSULTEC) Sendo M = {x N; x =
- Page 57 and 58:
EXERCÍCIOS DE SALA: 1. (UEFS-07.1)
- Page 59 and 60:
5. (UDESC SC/2012/Janeiro) Consider
- Page 61 and 62:
11. (UEFS) Sobre um grupo de 40 ana
- Page 63 and 64:
PLANO CARTESIANO SISTEMA CARTESIANO
- Page 65 and 66:
FUNÇÃO 1- DEFINIÇÃO: Sendo A e
- Page 67 and 68:
3. (UEFS) Sabendo-se que a função
- Page 69 and 70:
5.6 Função crescente Uma função
- Page 71 and 72:
5.10 Função inversa Dada uma fun
- Page 73 and 74: 3. (UNEB) Considerando a função r
- Page 75 and 76: 9. (UNIMONTES MG/2008) Todas as afi
- Page 77 and 78: FUNÇÃO POLINOMIAL DO 1 º GRAU IN
- Page 79 and 80: 3. (UEFS) A expressão que define a
- Page 81 and 82: INEQUAÇÕES PRODUTO: É toda inequ
- Page 83 and 84: ) c) d) e) 4. (ENEM/2012) As curvas
- Page 85 and 86: 8. (ENEM/2010) Em fevereiro, o gove
- Page 87 and 88: Nos dois casos, a função linear y
- Page 89 and 90: A representação gráfica de uma f
- Page 91 and 92: ESTUDO DA FUNÇÃO DO 2° GRAU: 1.
- Page 93 and 94: 4. (UNEB) Da análise do gráfico o
- Page 95 and 96: 5. (UNEB) Os gráficos representama
- Page 97 and 98: 12. (UFPB - PSS 2008) Dois jóqueis
- Page 99 and 100: 17. (CONSULTEC) O domínio da funç
- Page 101 and 102: 4. FUNÇÃO EXPONENCIAL: Consideram
- Page 103 and 104: 03) [-1, 0[ 04) [0, 1[ 05) [1, 2] 3
- Page 105 and 106: 9. (UEFS) Estima-se que daqui a t a
- Page 107 and 108: 15. (UESC) Uma droga é injetada na
- Page 109 and 110: LOGARÍTMO DEFINIÇÃO: Sejam a e n
- Page 111 and 112: 3. (UESB) A equação 2 x-1 = 6 é
- Page 113 and 114: 3. (Uepa-2008) O pH de uma soluçã
- Page 115 and 116: 1. A acidez dos alimentos é determ
- Page 117 and 118: 2. Se é denominada de decresce
- Page 119 and 120: 5. (UEFS) O gráfico que melhor rep
- Page 121 and 122: 5. (UNEB) Sabendo-se que log 2 x =
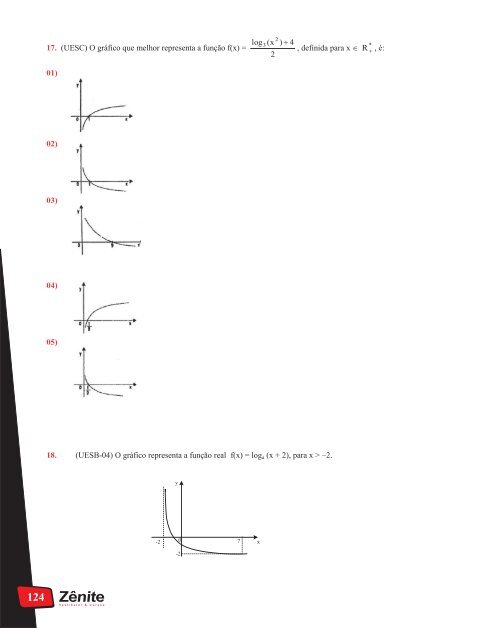
- Page 123: 13. (UEFS-04.2) A expressão a) b)
- Page 127 and 128: 24. (UESB-2013) Considere-se a fun
- Page 129 and 130: ) () c) () d) () e) ()
- Page 131 and 132: f) g) ( ) h) i)
- Page 133 and 134: d) e) f) EXRCÍCIOS
- Page 135 and 136: 7. (Ufsc) 1. Considere a função f
- Page 137 and 138: 2. (FGV-2008) A soma de todos os in
- Page 139 and 140: 10. . (FCC- 2006) Assinale a altern
- Page 141 and 142: ( ) Se liga.: 3 termos em
- Page 143 and 144: 2. (UEFS) Um motorista comprou um a
- Page 145 and 146: 10. (FIPMOC-2011) Na compra a prazo
- Page 147 and 148: PROGRESSÃO GEOMÉTRICA PROGRESSÃO
- Page 149 and 150: EXERCÍCIOS DE SALA: 1. (FDC-2009.2
- Page 151 and 152: 4. (UEFS) A figura é composta por
- Page 153 and 154: 10. (Uflavras) Sabendo-se que os n
- Page 155 and 156: 2.Simplifíque as expressões: a)
- Page 157 and 158: Efetuando-se a soma 4! + 6! + 8! +
- Page 159 and 160: PROBLEMAS DE CONTAGEM: Análise Com
- Page 161 and 162: 8. (UNEB) Um empresário, visando p
- Page 163 and 164: 4. (Ufam) As cidades A, X, Y, Z e B
- Page 165 and 166: 9. Há 10 pessoas em um local, send
- Page 167 and 168: 15. A equipe de vôlei do Colégio
- Page 169 and 170: Números binomiais complementares:
- Page 171 and 172: 5. Os valores de x que satisfazem a
- Page 173 and 174: COMBINAÇÃO SIMPLES Combinação s
- Page 175 and 176:
5. (UNEB) Colocando-se em ordem cre
- Page 177 and 178:
01) 6A 5,2 02) 8C 5,2 03) 2A 5,2 A
- Page 179 and 180:
5. QUANTOS anagramas podem ser form
- Page 181 and 182:
13. (FATEC-2008) Para mostrar aos s
- Page 183 and 184:
21. (2010/ESAF) O departamento de v
- Page 185 and 186:
29. (Pucmg 2003) Um bufê produz 6
- Page 187 and 188:
BINÔMIO DE NEWTON DESENVOLVIMENTO
- Page 189 and 190:
3. Considerando o desenvolvimento d
- Page 191 and 192:
EXERCÍCIOS PROPOSTOS: 1. O coefici
- Page 193 and 194:
9. (UEPG PR) Considerando o Binômi
- Page 195 and 196:
6. (UCS-RS) Dois dados são jogados
- Page 197 and 198:
EXERCÍCIOS PRPOSTOS: 1. Uma empres
- Page 199 and 200:
6. (FDC-2011.1) Muitos hospitais pe
- Page 201 and 202:
10. (ENEM-2010) O controle de quali
- Page 203 and 204:
14. (ENEM-2012) Em um jogo há duas
- Page 205 and 206:
De acordo com o texto, se Cebolinha
- Page 207 and 208:
21. (Enem 2ª aplicação 2010) Um
- Page 209 and 210:
MATEMÁTICA FINANCEIRA RAZÃO É a
- Page 211 and 212:
REGRA DE TRÊS É uma regra que per
- Page 213 and 214:
7. Um construtor utilizando 16 oper
- Page 215 and 216:
4. Um bloco de mármore de 3m de co
- Page 217 and 218:
Para o engenheiro fazer esse desenh
- Page 219 and 220:
16. Uma torneira enche um tanque em
- Page 221 and 222:
As figuras mostram que as proporcio
- Page 223 and 224:
26. (UESB-2013) Com a redução do
- Page 225 and 226:
3. (PUC-MG/2009) Pensando em aument
- Page 227 and 228:
9.(UNEB) Os salários dos funcioná
- Page 229 and 230:
S 7. (UEFS2) Para melhorar o fluxo
- Page 231 and 232:
13. (ENEM/2010) Uma empresa possui
- Page 233 and 234:
18. (ENEM/2010) Um dos estádios ma
- Page 235 and 236:
JUROS É a remuneração recebida p
- Page 237 and 238:
EXERCÍCIOS PROPOSTOS: 1. (CESGRANR
- Page 239 and 240:
9. (FUVEST ) Um comerciante deu um
- Page 241 and 242:
16. ( UESC) Calcule o tempo para qu
- Page 243 and 244:
FREQÜÊNCIA ACUMULADA ( Fa ) É da
- Page 245 and 246:
MÉDIA GEOMÉTRICA ( M G ) A média
- Page 247 and 248:
4. (UNEB) Se o gráfico representa
- Page 249 and 250:
8. (UESB-2013) Analisando-se o grá
- Page 251 and 252:
2. (ENEM/2009) Suponha que a etapa
- Page 253 and 254:
6. (ENEM/2011) Uma equipe de especi
- Page 255 and 256:
10. (UNEB-2014) De acordo com o gr
- Page 257 and 258:
15. (UESC) Para ser aprovado num cu
- Page 259 and 260:
20. (UNIFACS-2014) Seu local de res
- Page 261 and 262:
GEOMETRIA PLANA É a parte da geome
- Page 263 and 264:
Ex.: MEDIDA DE UM ÂNGULO: Os ângu
- Page 265 and 266:
Ângulos corespondentes são ângul
- Page 267 and 268:
ÂNGULO INSCRITO É o ângulo que p
- Page 269 and 270:
POLÍGONOS LINHA POLIGONAL É a uni
- Page 271 and 272:
ÂNGULO INTERNO( ) Em um polígono
- Page 273 and 274:
EXERCÍCIOS DE SALA: 1. Em uma circ
- Page 275 and 276:
PONTOS NOTÁVEIS DE UM TRIÂNGULO M
- Page 277 and 278:
TRIÂNGULOS SEMELHANTES Dois triân
- Page 279 and 280:
3. A figura abaixo nos mostra duas
- Page 281 and 282:
EXERCÍCIOS DE SALA: 1. Em um triâ
- Page 283 and 284:
Área em função do raio da circun
- Page 285 and 286:
TRIÂNGULO RETÂNGULO Razões trigo
- Page 287 and 288:
3. (UNEB) Se, no triângulo ABC, re
- Page 289 and 290:
EXERCÍCIOS DE SALA: 1. (UNEB) Na f
- Page 291 and 292:
QUADRILÁTEROS NOTÁVEIS PARALELOGR
- Page 293 and 294:
Trapézio isósceles As medidas dos
- Page 295 and 296:
2. (UNEB) Na figura, a soma das ár
- Page 297 and 298:
6. (ENEM/2009) A vazão do rio Tiet
- Page 299 and 300:
Relação entre uma secante e uma t
- Page 301 and 302:
CÍRCULO é o conjunto dos pontos i
- Page 303 and 304:
2. (UNEB) A figura representa um c
- Page 305 and 306:
2. (UEFS) Um fazendeiro comprou um
- Page 307 and 308:
7. (UESC-07) Se o lado do quadrado
- Page 309 and 310:
14. (Fuvest 2014) Uma das piscinas
- Page 311 and 312:
a) a) 1m b) b) 2m c) c) 2,4 m d) d)
- Page 313 and 314:
20. (Enem 2012) Para decorar a fach
- Page 315 and 316:
24. (ENEM/2009) Ao morrer, o pai de
- Page 317 and 318:
28. (ENEM/2010) Um balão atmosfér
- Page 319 and 320:
32. (UESB-2010) Uma escuna, navegan
- Page 321 and 322:
- 01) 02) 03) 04) 05)
- Page 323 and 324:
Cálculo de Áreas e Volumes
- Page 325 and 326:
PARALELEPÍPEDO É todo prisma na q
- Page 327 and 328:
CUBO É o poliedro regular onde as
- Page 329 and 330:
CILINDRO É o sólido obtido pela r
- Page 331 and 332:
4. (Mackenzie-SP) A altura de um ci
- Page 333 and 334:
EXERCÍCIOS DE SALA 1. Fuvest - SP)
- Page 335 and 336:
6. (Fuvest) As bases de um tronco d
- Page 337 and 338:
10. (Ufrrj) Considerando um lustre
- Page 339 and 340:
EXERCÍCIOS DE SALA 1. (Pucsp) A ba
- Page 341 and 342:
ESFERA Esfera é toda região do es
- Page 343 and 344:
2. (UESB-2010) Uma lata cilíndrica
- Page 345 and 346:
9. (UNEB-2010) De um cubo maciço d
- Page 347 and 348:
13. (ENEM/2009) Um artesão constru
- Page 349 and 350:
A escolha do bebedouro. In: Biotema
- Page 351 and 352:
20. - (ENEM/2010) Uma empresa de re
- Page 353 and 354:
25. (UEFS) Um lojista pretende colo
- Page 355 and 356:
01) 02) 03) 04) 05) 3 3 3 4 2 3 7 2
- Page 357 and 358:
BARICENTRO DE UM TRIÂNGULO: O bari
- Page 359 and 360:
Coeficiente angular ( ) - inddica a
- Page 361 and 362:
POSIÕES RELATIVAS ENTRE DUAS RETAS
- Page 363 and 364:
2. (UFOP MG/2007/Janeiro) Num siste
- Page 365 and 366:
PONTOS INTERNOS E EXTERNOS A UMA CI
- Page 367 and 368:
Circunferências internas A distân
- Page 369 and 370:
2. (UNEB) A reta 3x + 4y - 6 = 0 de
- Page 371 and 372:
EXERCÍCIOS PROPOSTOS 1. (UEFS) O m
- Page 373 and 374:
7. (UESB) Num sistema de eixos orto
- Page 375 and 376:
13. (UEFS) Os lados AB e BC de um
- Page 377 and 378:
19. (UEFS) Seja P o ponto de inters
- Page 379 and 380:
26. (UEFS) A circunferência repres
- Page 381 and 382:
MATRIZES É toda disposição retan
- Page 383 and 384:
TIPOS DE MATRIZES Matriz linha De
- Page 385 and 386:
EXERCÍCIOS DE SALA: 3 4 y 1 A
- Page 387 and 388:
2. (ENEM/2012) Um aluno registrou a
- Page 389 and 390:
DETERMINANTES A toda e qualquer mat
- Page 391 and 392:
Cofator() O cofator() é um núme
- Page 393 and 394:
3ª PROPRIEDADE : Se duas linhas ou
- Page 395 and 396:
3. (UNEB) Se x A 2x x 1 1 , det
- Page 397 and 398:
SISTEMAS LINEARES Equação linear
- Page 399 and 400:
CLASSIFICAÇÃO DE UM SISTEMA LINEA
- Page 401 and 402:
EXERCÍCIOS PROPOSTOS 1. .(UESC-05)
- Page 403 and 404:
8. (UESC) Se é igual a: a 1 a 2
- Page 405 and 406:
a b 2 -1 - 2 3 15. (UFBA) Dadas as
- Page 407 and 408:
(04) a matriz transposta de B é 1
- Page 409 and 410:
a 3 1 24. (ITA) Seja a R e consider
- Page 411 and 412:
RADIANO O radiano é uma outra form
- Page 413 and 414:
3. (Cefet - PR) A rua Tenório Quad
- Page 415 and 416:
Função Tangente Define-se a funç
- Page 417 and 418:
Função Secante Define-se função
- Page 419 and 420:
EXERCÍCIOS DE SALA 1. A função t
- Page 421 and 422:
2. (Udesc) A expressão ()
- Page 423 and 424:
EQUAÇÕES TRIGONOMÉTRICAS É toda
- Page 425 and 426:
3. (UEFS) O valor de sen(1120º) -
- Page 427 and 428:
9. (UESC) Considerando-se a represe
- Page 429 and 430:
Uma pessoa que subiu 3 2 dessa esca
- Page 431 and 432:
23. (URFS2) O ponto P, na figura, t
- Page 433 and 434:
29. (UNICAMP - 2008 - Adaptada) Uma
- Page 435 and 436:
EXERCÍCIOS DE SALA 1. (UCMG) - O n
- Page 437 and 438:
OPERAÇÕES NA FORMA TRIGONOMÉTRIC
- Page 439 and 440:
4. (UESC) Na forma trigonométrica,
- Page 441 and 442:
10. (UEFS) No plano complexo, o con
- Page 443 and 444:
16. (UNEB) O número complexo z = a
- Page 445 and 446:
24. (UEL) A potência ( ) é ig
- Page 447 and 448:
EXERCÍCIOS DE SALA 1. (Mack) O pol
- Page 449 and 450:
3. (FGV - SP) O valor de m , de mod
- Page 451 and 452:
7. (UEFS) Sendo o polinômio P(x) =
- Page 453 and 454:
15. (UEFS) Os números 1 e i são r
- Page 455 and 456:
23. (PUC - SP) - Qual dos números
- Page 457 and 458:
SÍMBOLOS DE MEDIDAS GRANDEZA Símb
- Page 459 and 460:
459
- Page 461 and 462:
461