- Page 1 and 2:
INSTITUTO DE PLANEJAMENTO E ECONOMI
- Page 3 and 4:
APRESENTAÇÃOSÍNTESE ANUAL DA AGR
- Page 5 and 6:
SUMÁRIOPARTE IDESEMPENHO DO AGRONE
- Page 7 and 8:
CONVENÇÕES= números entre parên
- Page 9:
Parte1
- Page 12 and 13:
12SÍNTESE ANUAL DA AGRICULTURA DES
- Page 14 and 15:
14SÍNTESE ANUAL DA AGRICULTURA DES
- Page 16 and 17:
16SÍNTESE ANUAL DA AGRICULTURA DES
- Page 18 and 19:
TABELA 2/I - VALOR BRUTO DA PRODUÇ
- Page 20 and 21:
20SÍNTESE ANUAL DA AGRICULTURA DES
- Page 22 and 23:
22SÍNTESE ANUAL DA AGRICULTURA DES
- Page 24 and 25:
24SÍNTESE ANUAL DA AGRICULTURA DES
- Page 26 and 27:
TABELA 1/I - ALHO - ÁREA PLANTADA,
- Page 28 and 29:
28SÍNTESE ANUAL DA AGRICULTURA DES
- Page 30 and 31:
30SÍNTESE ANUAL DA AGRICULTURA DES
- Page 32 and 33:
32SÍNTESE ANUAL DA AGRICULTURA DES
- Page 34 and 35:
TABELA 1/I - ARROZ - EVOLUÇÃO MUN
- Page 36 and 37:
36SÍNTESE ANUAL DA AGRICULTURA DES
- Page 38 and 39:
38TABELA 7/I - ARROZ - RENDIMENTO M
- Page 40 and 41:
Outra, de maior repercussão, resul
- Page 42 and 43:
42SÍNTESE ANUAL DA AGRICULTURA DES
- Page 44 and 45:
44SÍNTESE ANUAL DA AGRICULTURA DES
- Page 46 and 47:
TABELA 1/I - BANANA - EVOLUÇÃO NO
- Page 48 and 49:
48TABELA 4/I - FRUTAS - CONSUMO PER
- Page 50 and 51:
50SÍNTESE ANUAL DA AGRICULTURA DES
- Page 52 and 53:
TABELA 9/I - BANANA - EVOLUÇÃO DO
- Page 54 and 55:
54SÍNTESE ANUAL DA AGRICULTURA DES
- Page 56 and 57:
56BATATASÍNTESE ANUAL DA AGRICULTU
- Page 58 and 59:
TABELA 2/I - BATATA - EXPECTATIVA D
- Page 60 and 61:
60CEBOLASÍNTESE ANUAL DA AGRICULTU
- Page 62 and 63:
62SÍNTESE ANUAL DA AGRICULTURA DES
- Page 64 and 65:
64SÍNTESE ANUAL DA AGRICULTURA DES
- Page 66 and 67:
66TABELA 1/I - FEIJÕES SECOS - EVO
- Page 68 and 69:
68SÍNTESE ANUAL DA AGRICULTURA DES
- Page 70 and 71:
70SÍNTESE ANUAL DA AGRICULTURA DES
- Page 72 and 73:
72SÍNTESE ANUAL DA AGRICULTURA DES
- Page 74 and 75:
74SÍNTESE ANUAL DA AGRICULTURA DES
- Page 76 and 77:
76SÍNTESE ANUAL DA AGRICULTURA DES
- Page 78 and 79:
plantio da safrinha, que, por sua v
- Page 80 and 81:
80FUMOSÍNTESE ANUAL DA AGRICULTURA
- Page 82 and 83:
82SÍNTESE ANUAL DA AGRICULTURA DES
- Page 84 and 85:
84SÍNTESE ANUAL DA AGRICULTURA DES
- Page 86 and 87:
86SÍNTESE ANUAL DA AGRICULTURA DES
- Page 88 and 89:
88MAÇÃSÍNTESE ANUAL DA AGRICULTU
- Page 90 and 91:
TABELA 2/I - MAÇÃ - ÁREA PLANTAD
- Page 92 and 93:
92MANDIOCASÍNTESE ANUAL DA AGRICUL
- Page 94 and 95:
94TABELA 2/I - FARINHA DE MANDIOCA
- Page 96 and 97:
TABELA 6/I - RAIZ DE MANDIOCA - ÁR
- Page 98 and 99:
98SÍNTESE ANUAL DA AGRICULTURA DES
- Page 100 and 101:
100SÍNTESE ANUAL DA AGRICULTURA DE
- Page 102 and 103:
SÍNTESE ANUAL DA AGRICULTURA DESAN
- Page 104 and 105:
104MILHOSÍNTESE ANUAL DA AGRICULTU
- Page 106 and 107:
106SÍNTESE ANUAL DA AGRICULTURA DE
- Page 108 and 109:
108SÍNTESE ANUAL DA AGRICULTURA DE
- Page 110 and 111:
110SÍNTESE ANUAL DA AGRICULTURA DE
- Page 112 and 113:
TABELA 6/I - MILHO - ÁREA PLANTADA
- Page 114 and 115:
114SOJASÍNTESE ANUAL DA AGRICULTUR
- Page 116 and 117:
116SÍNTESE ANUAL DA AGRICULTURA DE
- Page 118 and 119:
118SÍNTESE ANUAL DA AGRICULTURA DE
- Page 120 and 121:
TABELA 4/I - SOJA - ÁREA PLANTADA,
- Page 122 and 123:
122SÍNTESE ANUAL DA AGRICULTURA DE
- Page 124 and 125:
TABELA 3/I - TOMATE - ÁREA PLANTAD
- Page 126 and 127:
126SÍNTESE ANUAL DA AGRICULTURA DE
- Page 128 and 129:
128SÍNTESE ANUAL DA AGRICULTURA DE
- Page 130 and 131:
130SÍNTESE ANUAL DA AGRICULTURA DE
- Page 132 and 133:
132SÍNTESE ANUAL DA AGRICULTURA DE
- Page 134 and 135:
134SÍNTESE ANUAL DA AGRICULTURA DE
- Page 136 and 137:
136TABELA 9/I - TRIGO - QUANTIDADE
- Page 138 and 139:
138UVASÍNTESE ANUAL DA AGRICULTURA
- Page 140 and 141: 140SÍNTESE ANUAL DA AGRICULTURA DE
- Page 142 and 143: 142SÍNTESE ANUAL DA AGRICULTURA DE
- Page 144 and 145: TABELA 1/I - NÚMERO DE MUNICÍPIOS
- Page 146 and 147: 146SÍNTESE ANUAL DA AGRICULTURA DE
- Page 148 and 149: 148SÍNTESE ANUAL DA AGRICULTURA DE
- Page 150 and 151: TABELA 15/I - QUANTIDADE MÉDIA DE
- Page 152 and 153: TABELA 18/I - PERFIL GERENCIAL DOS
- Page 154 and 155: 154SÍNTESE ANUAL DA AGRICULTURA DE
- Page 156 and 157: 156SÍNTESE ANUAL DA AGRICULTURA DE
- Page 158 and 159: 158SÍNTESE ANUAL DA AGRICULTURA DE
- Page 160 and 161: 160SÍNTESE ANUAL DA AGRICULTURA DE
- Page 162 and 163: TABELA 25/I - PRODUÇÃO COMERCIALI
- Page 164 and 165: TABELA 27/I - EXPORTAÇÕES CATARIN
- Page 166 and 167: 166SÍNTESE ANUAL DA AGRICULTURA DE
- Page 168 and 169: 168CALENDÁRIO AGRÍCOLACALENDÁRIO
- Page 170 and 171: 170DESEMPENHO DA PRODUÇÃO ANIMALS
- Page 172 and 173: 172SÍNTESE ANUAL DA AGRICULTURA DE
- Page 174 and 175: 174CARNE BOVINASÍNTESE ANUAL DA AG
- Page 176 and 177: TABELA 2/I - CARNE BOVINA - OFERTA
- Page 178 and 179: 178CARNE SUÍNASÍNTESE ANUAL DA AG
- Page 180 and 181: 180SÍNTESE ANUAL DA AGRICULTURA DE
- Page 182 and 183: 182SÍNTESE ANUAL DA AGRICULTURA DE
- Page 184 and 185: TABELA 11/I - SUÍNOS - ABATES TOTA
- Page 186 and 187: 186SÍNTESE ANUAL DA AGRICULTURA DE
- Page 188 and 189: 188SÍNTESE ANUAL DA AGRICULTURA DE
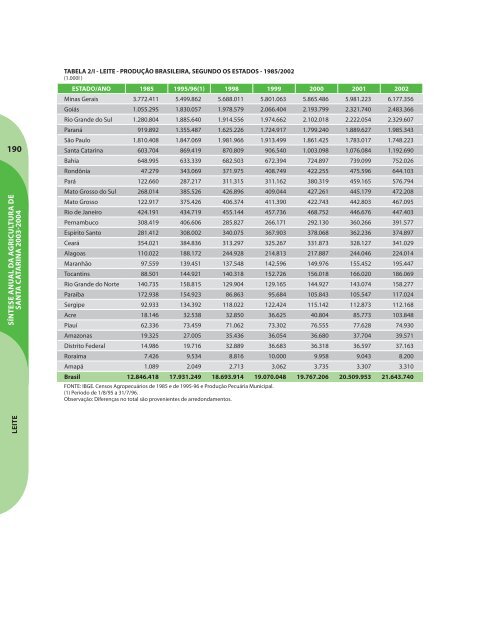
- Page 192 and 193: TABELA 4/I - LEITE - PRODUÇÃO DES
- Page 194 and 195: 194SÍNTESE ANUAL DA AGRICULTURA DE
- Page 196 and 197: 196SÍNTESE ANUAL DA AGRICULTURA DE
- Page 198 and 199: 198MELSÍNTESE ANUAL DA AGRICULTURA
- Page 200 and 201: 200SÍNTESE ANUAL DA AGRICULTURA DE
- Page 202 and 203: 202TABELA 4/I - MEL - PRODUÇÃO BR
- Page 204 and 205: TABELA 6/I - MEL - QUANTIDADE E VAL
- Page 206 and 207: TABELA 9/I - MEL - QUANTIDADE PRODU
- Page 208 and 209: 208OVOSSÍNTESE ANUAL DA AGRICULTUR
- Page 210 and 211: 210SÍNTESE ANUAL DA AGRICULTURA DE
- Page 212 and 213: produzidas na Região Sudeste, lide
- Page 214 and 215: TABELA 5/I - OVOS DE GALINHA - QUAN
- Page 216: 216SÍNTESE ANUAL DA AGRICULTURA DE
- Page 219 and 220: DESEMPENHO DA PESCA EAQÜICULTURA21
- Page 221 and 222: TABELA 2/I - PRODUÇÃO DA PESCA EX
- Page 223 and 224: TABELA 4/I - PREÇO DE PEIXES DESTI
- Page 225 and 226: TABELA 7/I - PREÇO DAS OSTRAS CULT
- Page 227 and 228: DESEMPENHO DO SETORFLORESTAL227SÍN
- Page 229 and 230: TABELA 1/I - PRODUÇÃO MUNDIAL DE
- Page 231 and 232: TABELA 3/I - PRODUÇÃO MUNDIAL DE
- Page 233 and 234: TABELA 6/I - VALOR DAS IMPORTAÇÕE
- Page 235 and 236: que mais se beneficiarão deste mer
- Page 237 and 238: TABELA 7/I - PRODUÇÃO DOS PRINCIP
- Page 239 and 240: perspectivas de expansão do setor
- Page 241 and 242:
O valor da produção total da ind
- Page 243 and 244:
Os EGP (edge glued panel - painel c
- Page 245 and 246:
Desempenho da Indústriade Móveis
- Page 247 and 248:
TABELA 12/I - PRODUÇÃO BRASILEIRA
- Page 249 and 250:
Embora seja um dos estados com meno
- Page 251 and 252:
251Segundo a Fiesc, do consumo tota
- Page 253 and 254:
Preços dos Insumos eProdutos Flore
- Page 255 and 256:
255SÍNTESE ANUAL DA AGRICULTURA DE
- Page 257 and 258:
257TABELA 16/I - EXPORTAÇÃO DE PR
- Page 259:
Parte2
- Page 262 and 263:
262SÍNTESE ANUAL DA AGRICULTURA DE
- Page 264 and 265:
264SÍNTESE ANUAL DA AGRICULTURA DE
- Page 266 and 267:
266SÍNTESE ANUAL DA AGRICULTURA DE
- Page 268 and 269:
268 CARACTERIZAÇÃOSOCIOECONÔMICA
- Page 270 and 271:
270SÍNTESE ANUAL DA AGRICULTURA DE
- Page 272 and 273:
272SÍNTESE ANUAL DA AGRICULTURA DE
- Page 274 and 275:
274SÍNTESE ANUAL DA AGRICULTURA DE
- Page 276 and 277:
276continuaçãoMUNICÍPIOPOPULAÇ
- Page 278 and 279:
278SÍNTESE ANUAL DA AGRICULTURA DE
- Page 280 and 281:
280continuaçãoMICRORREGIÃO GEOGR
- Page 282 and 283:
282TABELA 18/II - CONSUMO APARENTE
- Page 284 and 285:
284 INFORMAÇÕESECONÔMICAS DAAGRO
- Page 286 and 287:
continuação286PRODUTOS EXPORTADOS
- Page 288 and 289:
288continuaçãoPRODUTOS 1997 1998
- Page 290 and 291:
continuaçãoANOMÊSARROZIRRIGADO(s
- Page 292 and 293:
292SÍNTESE ANUAL DA AGRICULTURA DE
- Page 294 and 295:
294SÍNTESE ANUAL DA AGRICULTURA DE
- Page 296 and 297:
296SÍNTESE ANUAL DA AGRICULTURA DE
- Page 298 and 299:
298SÍNTESE ANUAL DA AGRICULTURA DE
- Page 300 and 301:
300SÍNTESE ANUAL DA AGRICULTURA DE
- Page 303 and 304:
SECRETARIAS DE DESENVOLVIMENTOREGIO
- Page 305 and 306:
SÍNTESE ANUAL DA AGRICULTURA DESAN
- Page 307 and 308:
15ª SECRETARIA DE DESENVOLVIMENTO
- Page 309 and 310:
10ª SECRETARIA DE DESENVOLVIMENTO
- Page 311 and 312:
26ª SECRETARIA DE DESENVOLVIMENTO
- Page 313 and 314:
6ª SECRETARIA DE DESENVOLVIMENTO R
- Page 315 and 316:
11ª SECRETARIA DE DESENVOLVIMENTO
- Page 317 and 318:
17ª SECRETARIA DE DESENVOLVIMENTO
- Page 319 and 320:
24ª SECRETARIA DE DESENVOLVIMENTO
- Page 321 and 322:
23ª SECRETARIA DE DESENVOLVIMENTO
- Page 323 and 324:
19ª SECRETARIA DE DESENVOLVIMENTO
- Page 325 and 326:
2ª SECRETARIA DE DESENVOLVIMENTO R
- Page 327 and 328:
12ª SECRETARIA DE DESENVOLVIMENTO
- Page 329 and 330:
18ª SECRETARIA DE DESENVOLVIMENTO
- Page 331 and 332:
1ª SECRETARIA DE DESENVOLVIMENTO R
- Page 333 and 334:
9ª SECRETARIA DE DESENVOLVIMENTO R
- Page 335 and 336:
DIVISÃO TERRITORIAL DO ESTADO DESA
- Page 337 and 338:
continuaçãoMESORREGIÃO NORTE CAT
- Page 339 and 340:
continuaçãoJacinto MachadoMaracaj
- Page 341 and 342:
continuaçãocontinuaçãoSECRETARI
- Page 343 and 344:
continuaçãocontinuaçãoSECRETARI
- Page 345 and 346:
ASSOCIAÇÕES DE MUNCÍPIOS DOESTAD
- Page 347 and 348:
continuaçãoGrão ParáGravatalIma
- Page 349 and 350:
continuaçãoModeloPalmitosRiquezaR
- Page 351 and 352:
continuaçãoREGIÃO HIDROGRÁFICA
- Page 353 and 354:
continuaçãoREGIÃO HIDROGRÁFICA
- Page 355 and 356:
continuaçãoREGIÃO HIDROGRÁFICA
- Page 357 and 358:
continuaçãoREGIÃO HIDROGRÁFICA
- Page 359 and 360:
Pessoal ocupado - Pessoas que, em c
- Page 361 and 362:
362LISTA DE GRÁFICOSSÍNTESE ANUAL
- Page 363 and 364:
MEL1. Preços médios mensais receb
- Page 365 and 366:
366LISTA DE TABELASSÍNTESE ANUAL D
- Page 367 and 368:
Santa Catarina - Safra 02/03 ......
- Page 369 and 370:
5. Área colhida, produção e rend
- Page 371 and 372:
DESEMPENHO DA PRODUÇÃO ANIMAL372C
- Page 373 and 374:
374SÍNTESE ANUAL DA AGRICULTURA DE
- Page 375 and 376:
37630. Preços médios mensais rece
- Page 377:
378SÍNTESE ANUAL DA AGRICULTURA DE